
Fig. 4.
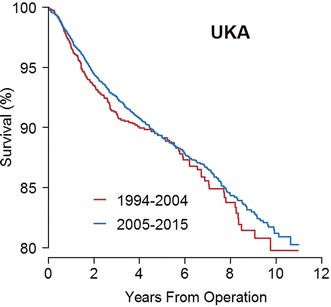
This Kaplan-Meier curve shows the implant survival during each period for UKAs. Log-rank test: p = 0.261. Ten years at risk 1994–2004: n = 59; 2005–2015: n = 302.
Official websites use .gov
A
.gov website belongs to an official
government organization in the United States.
Secure .gov websites use HTTPS
A lock (
) or https:// means you've safely
connected to the .gov website. Share sensitive
information only on official, secure websites.
This Kaplan-Meier curve shows the implant survival during each period for UKAs. Log-rank test: p = 0.261. Ten years at risk 1994–2004: n = 59; 2005–2015: n = 302.