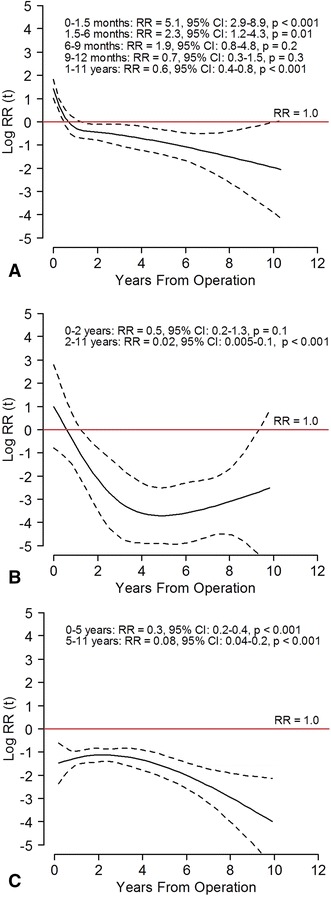
Fig. 6A–C.

The risk of revision during 2005 to 2015 (solid black line) with 95% CI (dotted lines) relative to 1994 to 2004 (red lines) in TKAs for (A) infection, (B) polyethylene wear/breakage, and (C) unexplained pain are shown. The horizontal red line indicates no difference in risk of revision (relative risk [RR], 1). The curves and estimates are adjusted by age, sex, diagnosis, fixation method, and use of patellar component. The RR estimates are divided in intervals to fulfill the proportional hazard assumption.
