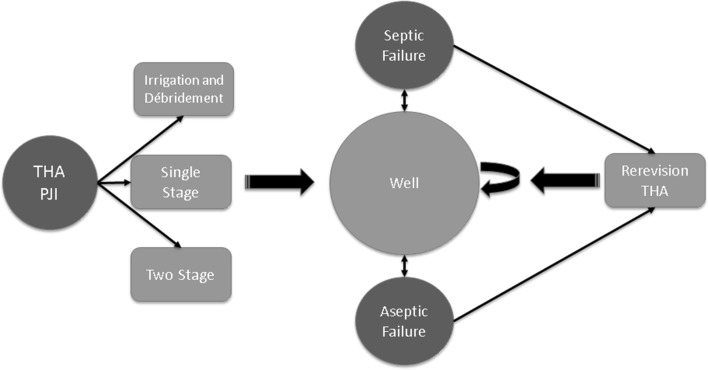
Fig. 1.
The flow chart shows the different health states of the Markov state-transition decision model and the various pathways along which patients may transition with time. The curved arrows represent the patient remaining in the same health state for the next analytic cycle. The absorbing states of failed repeat two-stage exchange and death are not shown.

