Fig. 1.

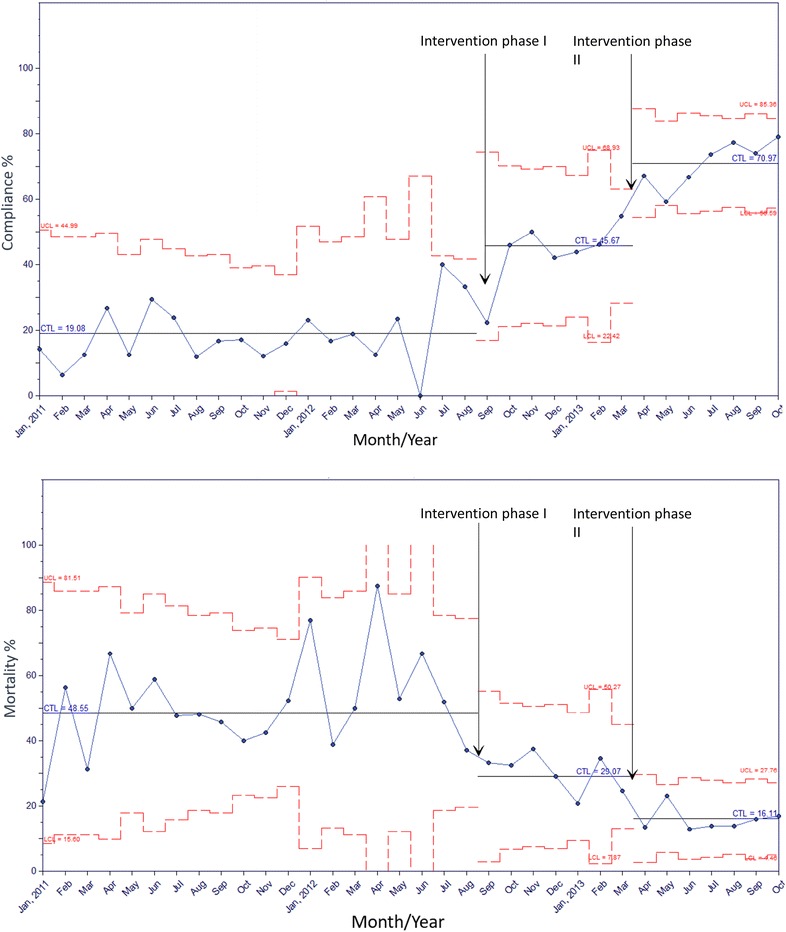
Control chart with upper and lower control limits of the overall compliance with the resuscitation bundle and the mortality in the three phases. The two arrows on the chart show the time of initiation of the intervention phases I and II

Control chart with upper and lower control limits of the overall compliance with the resuscitation bundle and the mortality in the three phases. The two arrows on the chart show the time of initiation of the intervention phases I and II