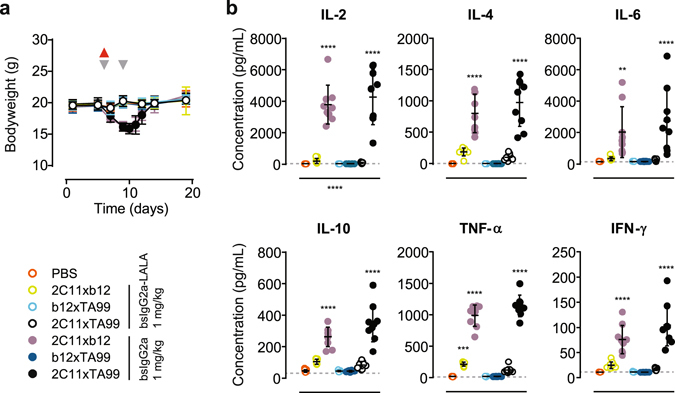
Figure 7.

Evaluation of in vivo toxicity in a syngeneic B16-F10 xenograft model. Mice were dosed as described in Fig. 6B with the indicated bsAb variants. (a) Bodyweight followed over time (grey arrowheads indicate treatment days; red arrowhead indicates blood sampling). Data represent mean bodyweight ± SEM. (b) Cytokine concentrations at 1–2 h after the first dose. Data represent individual mice & mean ± SD. Statistical significance (compared to PBS control group) was determined by one-way ANOVA (**P < 0.01; ***P < 0.001; ****P < 0.0001).
