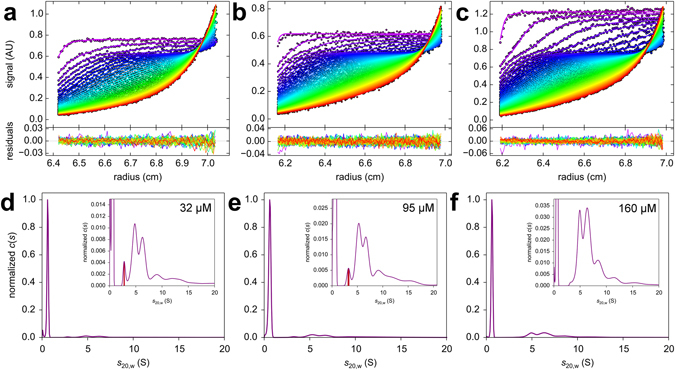
Figure 3.

SV analysis at high Aβ42 concentrations. Measured data overlaid with fit data and corresponding residuals are shown for 32 μM (a), 95 μM (b) and 160 μM (c) Aβ42. Below, c(s) analysis reveals the existence of a high fraction of larger oligomeric species aside from the monomer and a comparably low fraction of the 2 to 3 S species for 32 µM (d), 95 µM (e) and 160 µM (f) Aβ42. Sedimentation was performed at 60,000 rpm, 10 °C and monitored with absorbance detection at 280 nm. Normalization was performed according to peak height of the monomeric Aβ42. The insets show the distributions with an expanded y scale.
