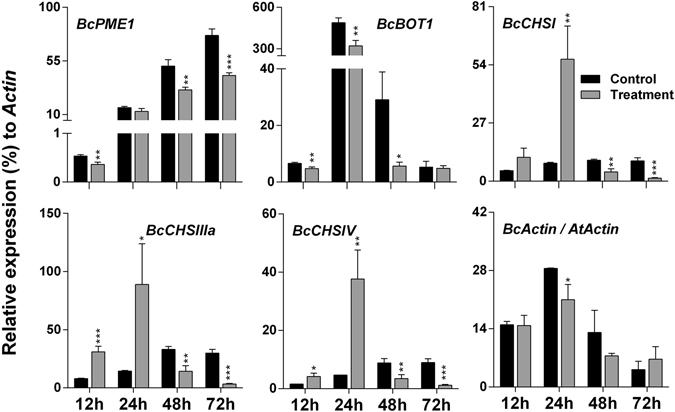
Figure 5.

Expression patterns of fungal virulence genes after infection with B. cinerea in A. thaliana exposed to 1000 Hz sound vibration. Five representative genes for fungal growth and virulence were tested at four time points (12, 24, 48, 72 h post inoculation). Expression of each fungal gene in the Arabidopsis exposed to a 1000 Hz sound vibration (gray) was compared with control (black) after normalization with B. cinerea ACTIN (BcACT). Accumulation of BcACT transcript in the inoculated leaves was calculated relative to A. thaliana ACTIN (AtACT) transcript. Bars represent mean and standard error of three biological replications. BcPME1, encoding pectin methyltransferase; BcBOT1, encoding cytochrome P450 monooxygenase; BcCHSI, BcCHSIIIa and BcCHSIV, encoding chitin synthases. P-value ranges are marked by asterisks: *** P < 0.01, ** 0.01 < P < 0.05, * P < 0.1.
