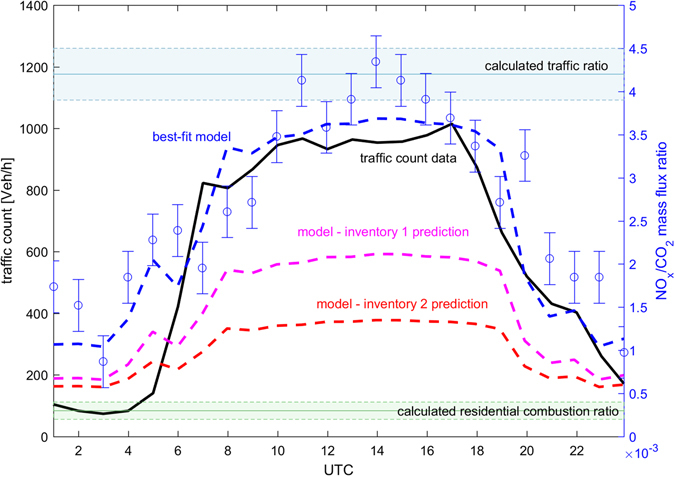
Figure 2.

Diurnal cycle of median traffic count data (black line - left axis), measured (blue circles) and model fitted (dashed blue line) mass flux ratio of NOx/CO2 (right axis). The corresponding calculated end members for traffic and residential combustion ratios are indicated by blue and green horizontal lines. The shading reflects one standard deviation. In addition colored dashed lines show predictions using fixed emission ratios from COPERT (magenta) and ACCMIP (red).
