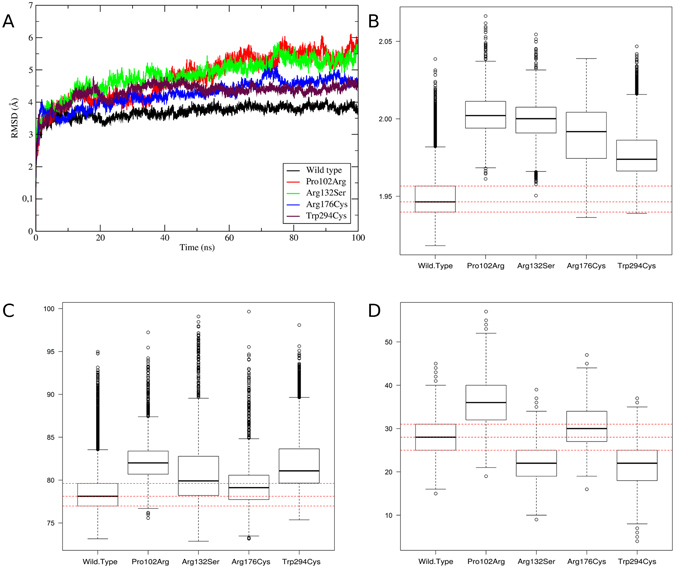
Figure 3.

ApoE3 native and variants trajectories analyses. In Backbone RMSD variation the variants are identified in the plots by different colors (A). Radius of gyration (B), solvent accessible surface area (C) and number of hydrogen bonds (D) are plotted in boxplots. On backbone RMSD (A) the variants are identified in the plots by colors: Native structure (black), Pro102Arg (red), Arg132Ser (green), Arg176Cys (blue) and Trp296Cys (turquoise). Only the number of hydrogen bonds between NT and CT domains was computed (D). Dotted red lines on solvent accessible surface area, radius of gyration and number of hydrogen bonds plots indicate the reference values of wild type. The solvent accessible surface and radius of gyration values are in nm² and to RMSD values in Å.
