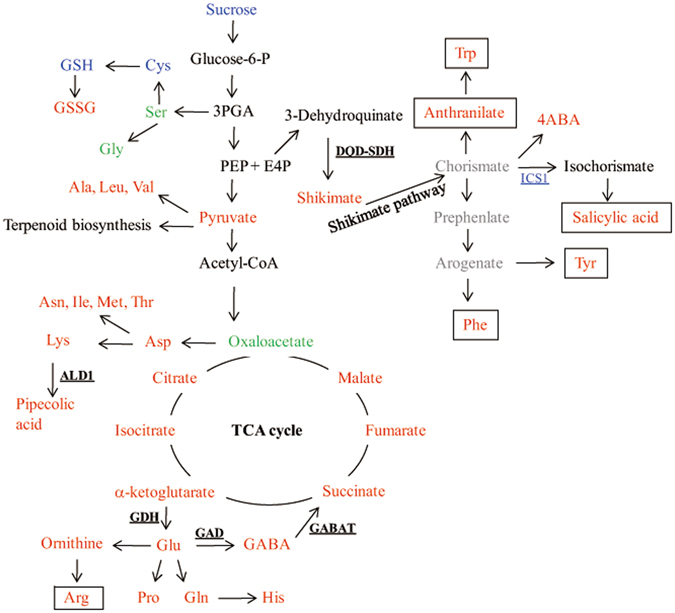
Figure 1.

Schematic overview of the changes in the primary metabolic biosynthesis pathways compared between dsOW62/76 and ZH17 plants. The compound in red, blue, and green indicated that its accumulation was increased, decreased, and not changed significantly in dsOW62/76 in related to ZH17 plants. The compound undetectable was in gray. Genes or enzymes were shown as underlined. The genes analyzed by qPCR were in red or blue, representing increase or decrease their transcription levels in dsOW62/76. Some of the genes upregulated in the transcriptome analysis were shown in bold. The compounds boxed are precursors may be mentioned in the later studies. Abbreviations: 4ABA, 4-aminobenzoic acid; E4P, erythrose 4-phosphate; GABA, γ-aminobutyric acid; GSH, glutathione; GSSG, glutathione oxidized; PEP, phosphoenolpyruvate; 3PGA, 3-phosphoglycerate; ALD1, aminotransferase 1; DQD-SDH, 3-dehydroquinate dehydratase-shikimate dehydrogenase; GABAT, 4-aminobutyrate-pyruvate transaminase; GAD, Glu decarboxylase; GAH, Glu dehydrogenase; ICS, isochorismate synthase.
