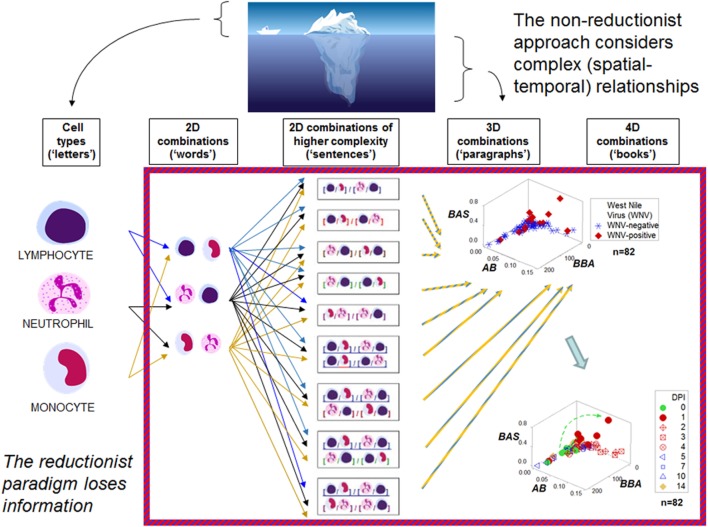
Figure 1.
Reductionist and non-reductionist views. An iceberg is used to describe (i) reductionism (the “tip of the iceberg”, i.e., an easily measured entity that does not express all the available information), and (ii) non-reductionism (a combinatorial and spatial–temporal analysis of biological complexity and dynamics, i.e., the area “below the surface”). These concepts are illustrated with an analogy that refers to written language. While simple elements (“letters”) lack meaning, combinations of increasing complexity (“words”, “sentences”, “paragraphs”, “books”) exhibit distinct patterns that facilitate the partitioning of the data into subsets. The hypothetical indicators measured in the three-dimensional (3D)/four-dimensional (4D) plots shown on the right side in the figure—a set taken from the large group of dimensionless indicators shown in the central column—are identified with descriptors that lack any known biological meaning: “BAS”, “AB”, and “BBA.” One example of a dimensionless indicator is the result from calculating: [M/L * N/M]/[N/L * L/M] over [M + L/N] * [L + N/M]/[N + M]/L * [M/N]. DPI: day(s) postinoculation with West Nile virus. Data source: Ref. (43).

