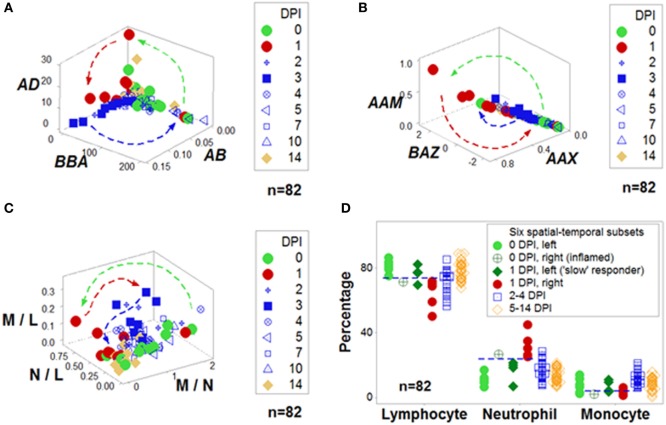
Figure 2.
Integration of non-reductionism and reductionism. To both validate and interpret the non-reductionist graphic patterns (described in Figure 1), additional non-reductionist data analyses and reductionist (cell type-based) operations may be required. Highly complex data structures can demonstrate both discrimination and robustness (A,B). In contrast, data structures of lower complexity may fail to distinguish changes that occur within 2 weeks (C). Based on spatial–temporal patterns, numerous data subsets may be identified and interpreted. For instance, in this example, before challenge [0 day(s) postinoculation (DPI)], all birds but one were located on the left side of the plots displayed in Figure 1 [light green circles (D)]. In contrast, 24 h later (at 1 DPI), most challenged birds were on the right side [red symbols (D)]. However, some birds appeared to be “slow” responders: even at 1 DPI, they exhibited the profile of 0 DPI birds [dark green diamonds (D)]. The opposite profile was displayed by one 0 DPI animal, which revealed high neutrophil and low lymphocyte percentages [e.g., a profile indicative of an inflammation not due to the experimental challenge, dark, green circle with inserted cross (D)]. Inferences are facilitated by arrows that denote temporal data directionality (A–C) as well as non-overlapping data distributions [indicated by the horizontal lines (D)]. Because most data combinations have identical contents—except the three “words” [L and M, N and M, and L and N, shown in (C)], any other combination includes all data points of all three cell types (A,B), information does not depend on data inputs (identical for all but three indicators) but relationships, e.g., three-dimensional/four-dimensional (spatial–temporal) data “shapes”, which can be rapidly validated and analyzed—as shown in the Movie S1 in Supplementary Material. Data source: Ref. (43).

