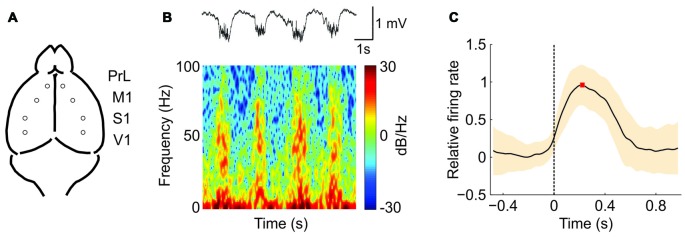
Figure 1.
Oscillatory activity in the PrL (prefrontal) cortex of a senescence accelerated mouse resistance 1 (SAMR1; control) mouse under ketamine anesthesia. (A) Spontaneous extracellular activity in deep layers was recorded simultaneously in both hemispheres for each cortical area (prelimbic, PrL; primary motor, M1; primary somatosensory, S1; and primary visual, V1). (B) Top: raw local field potential (LFP) from the right PrL cortex of a SAMR1 mouse showing the alternating Up (active) and Down (silent) states. Bottom: spectrogram showing the presence of high frequency rhythms, mainly during the Up states. (C) Waveform average of the mean multiunit activity (MUA) signal aligned at the Down-to-Up state transition (dashed line at time 0). This average is used for the calculation of the maximum (red square) firing rate (FR; see the “Materials and Methods” Section for further details). The shade corresponds to the SD.

