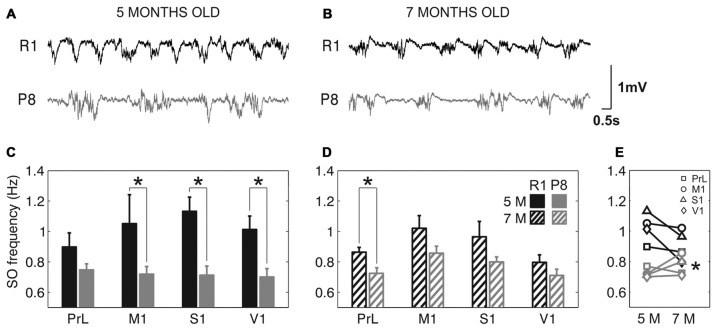
Figure 2.
Slow oscillation (SO) frequency in SAMR1 and SAM prone 8 (SAMP8) mice. (A,B) Raw LFP recordings from right M1 cortex at 5 and 7 months old, respectively, in SAMR1 (black) and SAMP8 mice (gray). (C,D) Population data comparing the SO frequency between SAMR1 (R1) and SAMP8 (P8) mice at 5 and 7 months of age, respectively, in the four cortical areas. (E) Population data showing the evolution of SO frequency in the transition from 5 months to 7 months old, in the four cortical areas in both groups. Bars and symbols depict the mean, error bars are SE. *p < 0.05 SAMP8 vs. SAMR1 (control) in (C,D), and 5 vs. 7 months of age for each cortical area and group in (E). 5 M (5 months old), 7 M (7 months old). Prelimbic cortex (PrL), primary motor cortex (M1), primary somatosensory cortex (S1), primary visual cortex (V1).

