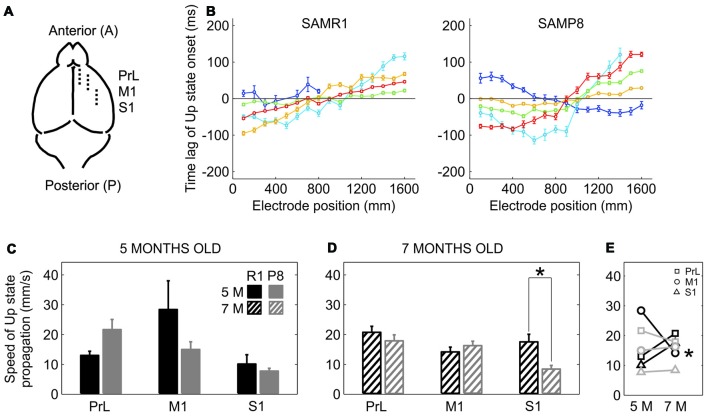
Figure 4.
Speed of propagation of Up state onsets in SAMR1 and SAMP8 mice. (A) Location and position of the 16 channel recording array (discontinuous line) in the PrL, M1 and S1 cortices. (B) Average time lags of Up state onsets recorded in the M1 area of a 5-month-old R1 (left) and P8 mice (right). Time lags were grouped in five different pools with similar patterns of activity propagation (each with different color) obtained with a principal component analysis (PCA; see the “Materials and Methods” Section for details). (C,D) Population data comparing the speed of Up state propagation between SAMR1 (black) and SAMP8 (gray) mice at 5 and 7 months old, respectively, in the three cortical areas. (E) Population data showing the evolution of Up state propagation in the transition from 5 months to 7 months old in the three cortical areas in both groups. Bars and symbols depict the mean, error bars are SE. *p < 0.05 SAMP8 vs. SAMR1 (control) in (C,D), and 5 vs. 7 months of age for each cortical area and group in (E). Other abbreviations as in Figure 2.

