Figure 5.
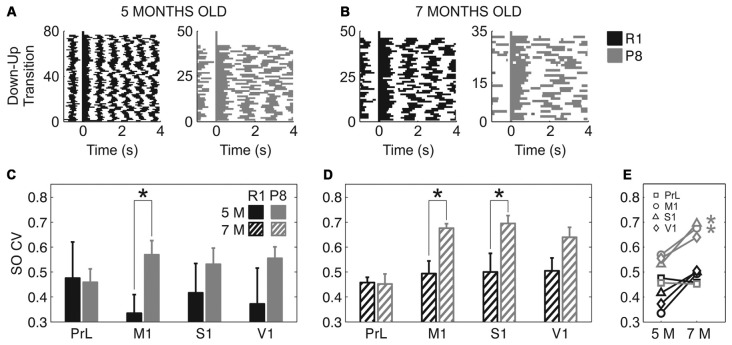
Coefficient of variation (CV) of the SO in SAMR1 and SAMP8 mice. (A,B) Representative raster plots of aligned Up states (detected during 1-min recordings) in M1 cortex at 5 and 7 months old, respectively, in a single SAMR1 (black) and SAMP8 (gray) mice. Decreased SO frequency and regularity in SAMP8 mice are clearly illustrated in these examples. (C,D) Population data comparing the CV of the SO between SAMR1 and SAMP8 mice at 5 and 7 months of age, respectively, in the four cortical areas. (E) Population data showing the evolution of the CV of the SO in the transition from 5 months to 7 months old in the four cortical areas in both groups. Bars and symbols depict the mean, error bars are SE. *p < 0.05 SAMP8 vs. SAMR1 (control) in (C,D), and 5 vs. 7 months of age for each cortical area and group in (E). Abbreviations as in Figure 2.

