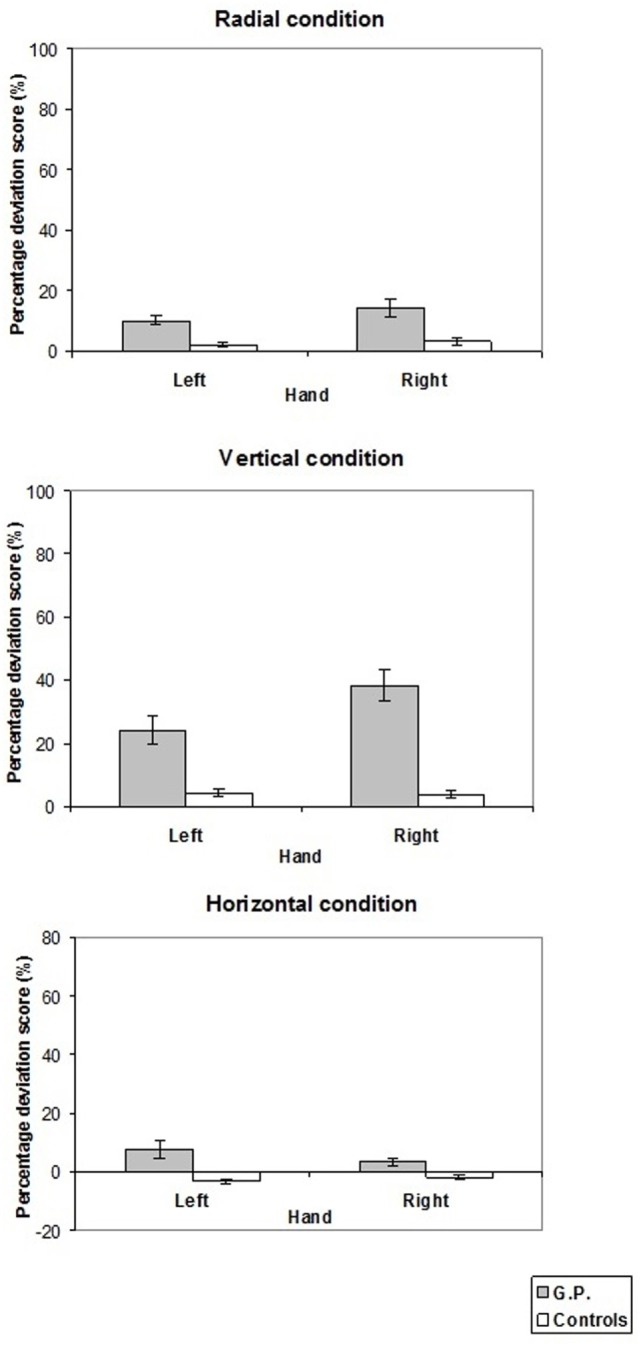
Figure 3.

Pattern of percentage deviation score measured in experiment 1. On the y-axis, (+) values indicate that the subjective midpoint was located farther than (radial lines), above (vertical lines), to the right of (horizontal lines) the true center; (−) values to the left of, nearer than, or below the true center. Mean values are shown with SE (bars).
