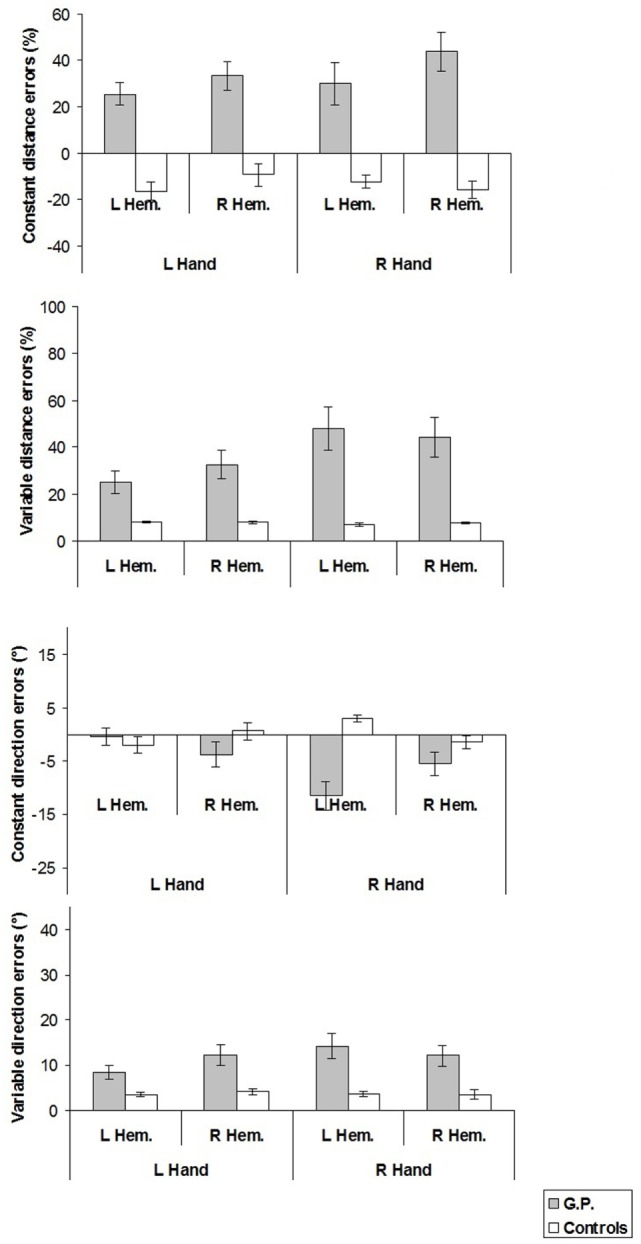
Figure 5.

Constant and variable distance and direction errors measured in experiment 2. For constant distance errors, on the y-axis, (+) values indicate reaching errors farther than the target location, (−) values nearer than the target location, with reference to the finger starting position. For constant direction errors, (+) values indicate reaching errors in the direction away from the median sagittal axis. Mean values are shown with SE (bars). L, left; R, right; Hem., hemispace.
