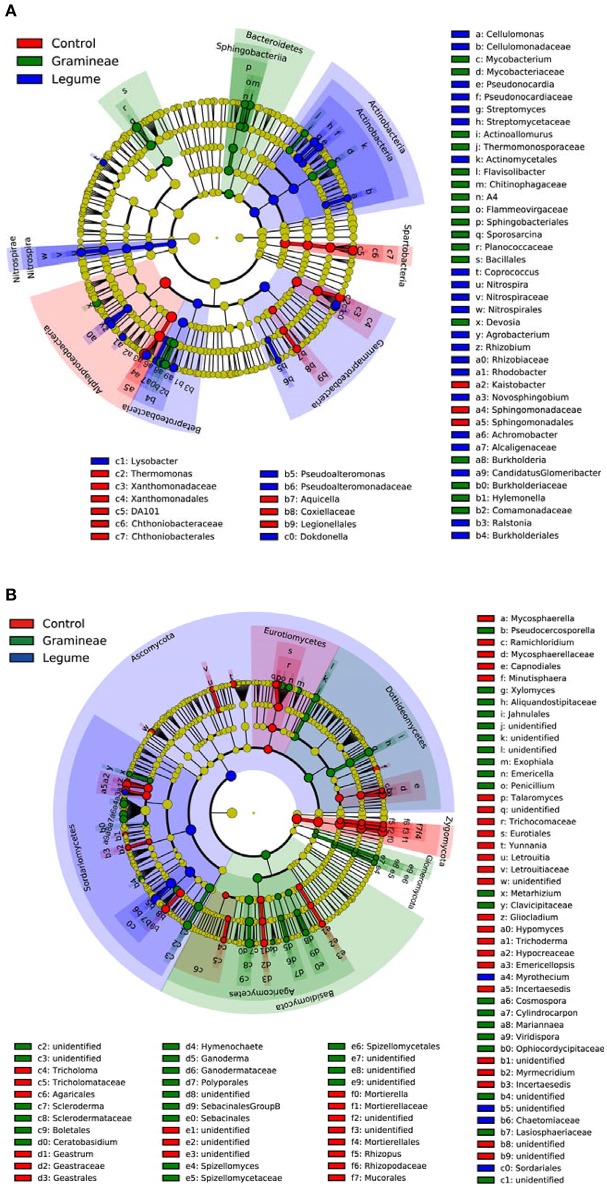
Figure 3.
Cladogram indicating the phylogenetic distribution of microbial lineages as affected by legume and grass. Each circle's diameter is proportional to the given taxon's relative abundance; circles represent phylogenetic levels from phylum to genus inside out. Red indicates control without plants, green indicates grass, blue indicates legume, and yellow indicates non-significant. (A) Bacteria; (B) Fungi.

