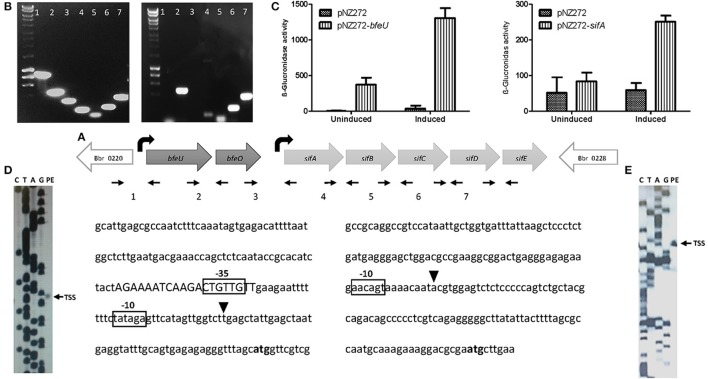
Figure 2.
Transcriptional analysis of the bfeUO/sifABCDE gene cluster: (A) Schematic representation of the bfeUO/sifABCDE gene cluster, curved black arrows represent the predicted transcriptional start sites present, straight small arrows indicate positions of primers used. Intergenic region between genes bfeU to sifE, are labeled as follows; 1 (Bbr_0220/bfeU), 2 (bfeU/bfeO), 3 (bfeO/sifA), 4 (sifA/sifB), 5 (sifB/sifC), 6 (sifC/sifD), and 7 (sifD/sifE). (B) RT-PCR of the intergenic regions from Bbr_0220 to Bbr_0228, intergenic regions are labeled as in (A). (C) β-glucuronidase assay of pNZ272+bfeU, pNZ272+sifA and pNZ272 (negative control). β-glucuronidase activity is expressed in Miller units. (D) Primer extension (PE) analysis of the transcriptional start site of bfeU. (E) PE analysis of transcriptional start site of sifA. In both (D,E) the start codon (ATG) is indicated in bold, the transcriptional start site (TSS) is indicated by a black triangle, the proposed −10 and −35 motifs are boxed and a possible operator sequence is displayed in uppercase.

