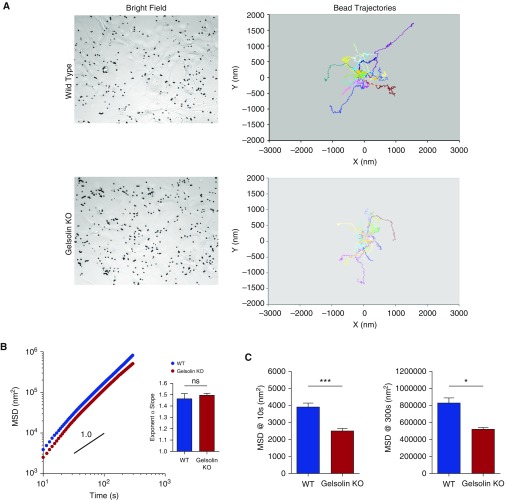
Figure 4.
Dynamics of the cytoskeleton network within the living ASM cells of WT and gelsolin KO mice. (A) Representative bright-field images and tracings of spontaneous bead motions on the living cells (showing 20 individual beads per group). (B) The trajectories of bead motions in two dimensions were characterized by computing the mean squared displacement (MSD) of all beads as a function of time t. Data are presented as mean (±SE; WT, n = 677 cells; gelsolin KO, n = 827 cells). Inset: the exponent α of the bead motions were estimated from a least square fit of a power law to the ensemble average of MSD data versus time for each well and averaged (n = 5–6 wells). (C) Computed MSD at 10 and 300 seconds (WT, n = 677 cells; gelsolin KO, n = 827 cells from five to six independent measurements; ***P < 0.0001, *P < 0.05).

