Figure 5.
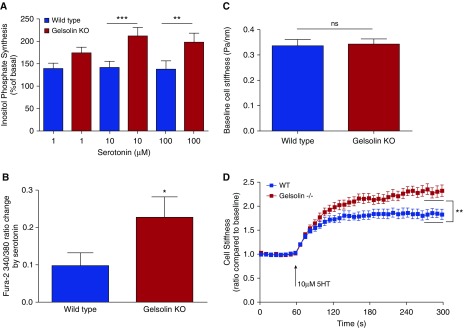
Gelsolin KO cells showed increased inositol phosphate synthesis, intracellular calcium release and single-cell contraction in response to serotonin. (A) Inositol phosphate synthesis at 20 minutes in response to serotonin in primary cultures of mouse ASM cells. Cells from gelsolin KO mice generated more inositol phosphate in response to the Gq-coupled ligand serotonin, consistent with an increased amount of phosphatidylinositol 4,5-bisphosphate substrate available for inositol phosphate synthesis in the absence of gelsolin (n = 5; **P < 0.01, ***P < 0.001). (B) Intracellular calcium concentrations in response to serotonin treatment were measured using the fura-2 ratiometric fluorescent indicator; 340:380 nm excitation ratio for fura-2 was obtained and normalized to the preinjection ratio. Gelsolin KO ASM cells showed significantly increased intracellular calcium in response to 100 μM serotonin (n = 6 from different sets of ASM cell cultures; *P < 0.05). (C and D) Stiffness of ASM cells from WT and gelsolin KO mice as measured by magnetic twisting cytometry in response to 10 μM serotonin (5HT). Baseline cell stiffness was not different between WT and gelsolin KO ASM cells (n = 15 individual wells of cells each). Cell stiffening in response to serotonin measured with this single-cell technology is a robust index of isolated ASM contraction. For each individual cell, baseline stiffness was measured for the first 60 seconds, and, after drug addition, stiffness was measured continuously for the next 240 seconds. For each cell, stiffness was normalized to its baseline stiffness before the agonist stimulation. The steady-state (last 30 s) maximal cell stiffening values, which are indicated by the black horizontal lines between 270 and 300 seconds, were compared. Gelsolin KO cells showed increased cell stiffening in response to serotonin compared with WT cells (n = 15 wells of cells measured from four independent experimental dates; **P < 0.01). Data are presented as mean (±SEM).

