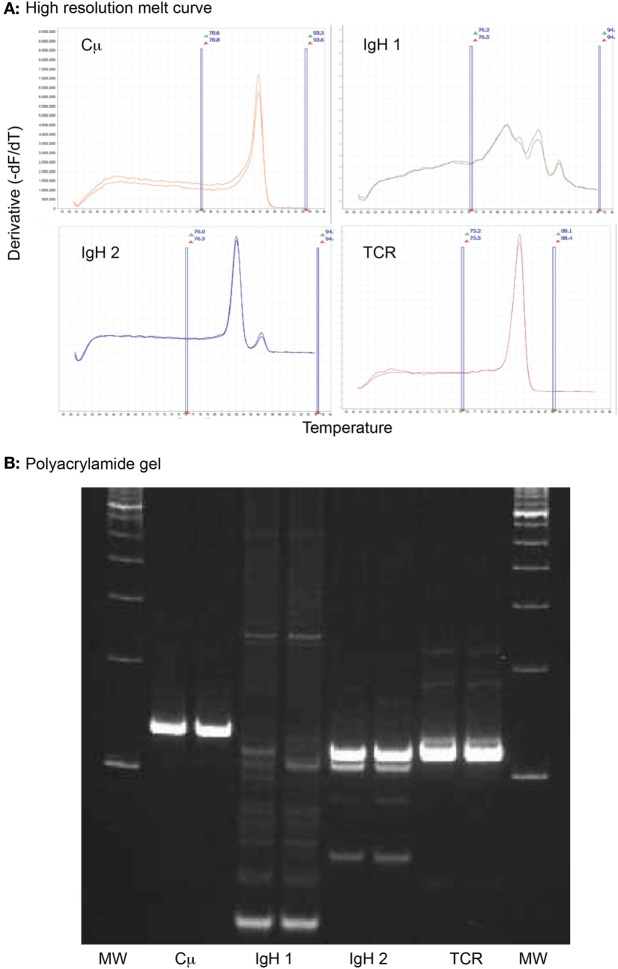
Figure 3.
High-resolution melt curve analysis of amplified DNA products retrieved from an archived venous blood smear of a dog with acute myeloid leukemia (case 1). (A) Sharp peaks in the negative derivative curves yielded from the normalized DNA melt curve showed that the tumor cells had clonal rearrangements in complementarity-determining region 3 (CDR3) of the immunoglobulin heavy chain with primer set 2 (IgH 2) and the CDR3 of T cell gamma receptor (TCR), i.e., a biclonal rearrangement. The multiple broad peaks with the first primer set for the CDR3 of the immunoglobulin heavy chain (IgH 1) is compatible with a polyclonal product. The positive control (Cμ) yielded the expected single peak. All reactions were run in duplicate. Note that all curves have the same Y- and X-axis. The area between the vertical blue lines represent the active melt curve region, in which the calculations are performed. (B) A 10% polyacrylamide gel was performed on the sample to verify the results of the high-resolution melt curve analysis. This showed a broad smear (polyclonal) with primer set 1 for the heavy chain CDR3 (IgH 1), a strong clonal band with primer set 2 for the heavy chain CDR3 (IgH 2), and a strong single clonal band with the T cell gamma receptor CDR3 primer set (TCR). The positive control (Cμ) yielded a single strong product, as expected. All reactions were run in duplicate. MW represents the molecular weight marker (100 base pair ladder).

