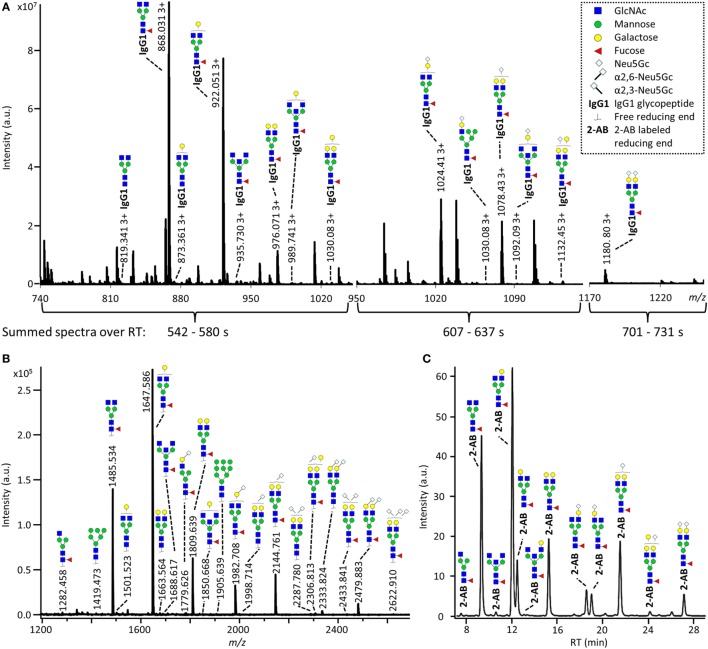
Figure 2.
Glycoforms detected by the three synergetic analysis methods. Representative data and analytes detected in the analysis of the pooled CD-1 sample, showing (A) immunoglobulin G1 (IgG1) fragment crystallizable (Fc)-glycopeptides analyzed by nanoliquid chromatography mass spectrometry (nanoLC-MS), (B) the 20 most abundant released glycans of total IgG analyzed by matrix-assisted laser desorption/ionization time-of-flight (MALDI-TOF)-MS after linkage-specific sialic acid derivatization, and (C) released glycans of total IgG analyzed by ultraperformance liquid chromatography (UPLC)-fluorescence after 2-AB labeling. Except for the sialic acid linkage in the MALDI-TOF-MS analysis (B), and the antenna galactosylation in the UPLC-fluorescence analysis (C), the monosaccharide linkages were not determined. The proposed glycan structures are based on fragmentation and literature (17, 23, 35, 36).

