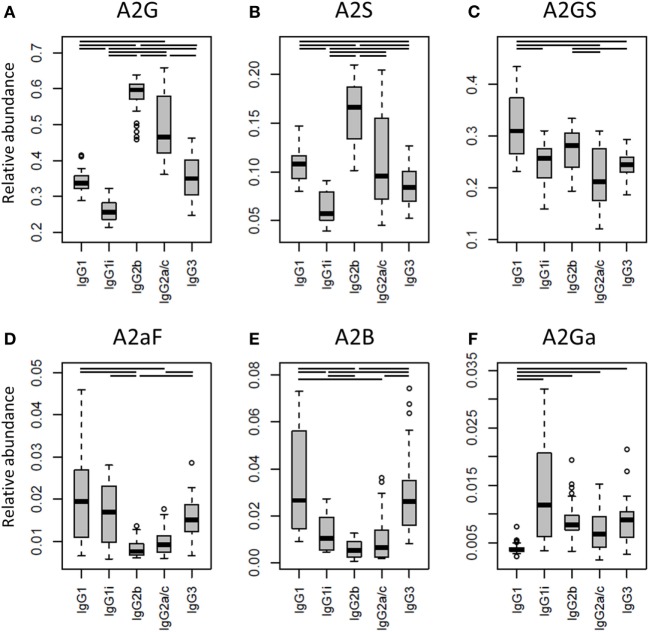
Figure 4.
Differences in the relative abundances of glycosylation traits between the immunoglobulin G (IgG) subclasses. Relative abundances of the derived glycosylation traits (A) galactosylation (A2G), (B) sialylation (A2S), (C) sialylation per galactose (A2GS), (D) afucosylation (A2aF), (E) bisection (A2B), and (F) α1,3-galactosylation (A2Ga) on the different IgG subclasses studied for the 40 individual mice of all strains. Significant differences between subclasses are indicated by black lines above the boxes. Box and whisker plots as described in Figure 3.

