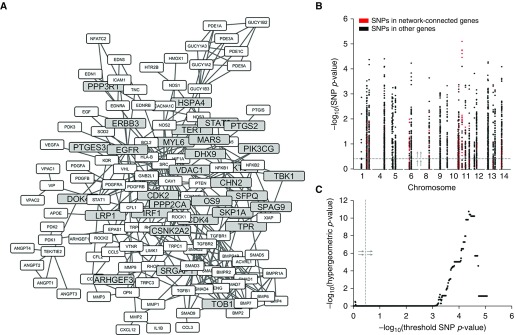
Figure 3.
Network-based filtering of candidate genes. (A) Graph showing network-connected candidate genes (gray) and their interactions with each other and with other known pulmonary hypertension (PH) genes (white). (B) Manhattan plot of SNPs in candidate genes filtered by phenotype screening and mapped to human orthologs. P values correspond to each SNP’s strength of association with the phenotype of fold change in RV MaxP. (C) Plot of –log10(P value) for the hypergeometric enrichment of SNPs in network-connected genes versus the threshold –log10(SNP P value) above which their enrichment was calculated. Dashed gray line with arrows (B and C) shows the visualization of the threshold for –log10(SNP P value).

