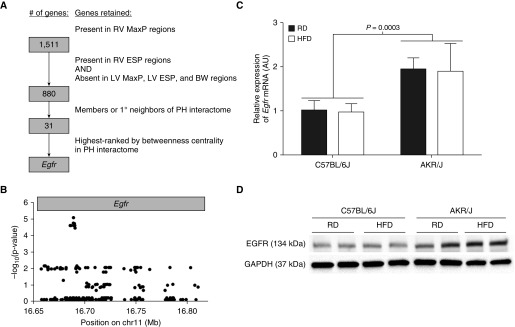
Figure 4.
GWAS filtering strategy identifies epidermal growth factor receptor (Egfr) as highest-ranked candidate gene. (A) Workflow summary showing filtering steps leading to identification of Egfr (BW, body weight; 1°, first degree). (B) SNPs located within the genomic coordinates of the mouse Egfr gene and their strengths of association with the phenotype of fold change in RV MaxP. C57BL/6J and AKR/J mice were fed RD or HFD diet for 20 weeks beginning at 6–12 weeks of age. (C) Expression of Egfr mRNA relative to that of a Gapdh endogenous control was measured by quantitative real-time PCR and expressed proportionally to its level in C57BL/6J mice fed an RD (n = 4 mice/diet per strain). P values were calculated by two-way ANOVA. (D) Levels of EGFR and GAPDH proteins were assessed by Western blot. Western blot is representative of two independent experiments (n = 4 mice/diet per strain).

