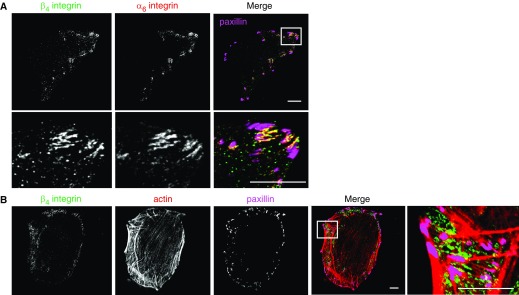
Figure 1.
α6β4 integrin exhibits a polarized distribution in A549 cells. (A) Confocal images of β4 integrin (green), α6 integrin (red), and the focal adhesion protein paxillin (pink). Scale bars, 10 µm. Lower panel, high magnification of the region in the inset. (B) Confocal images of β4 integrin (green), rhodamine-phalloidin as a marker of F-actin (red), and paxillin (pink). Scale bars, 10 µm. Right panel, high magnification of the region in the inset.

