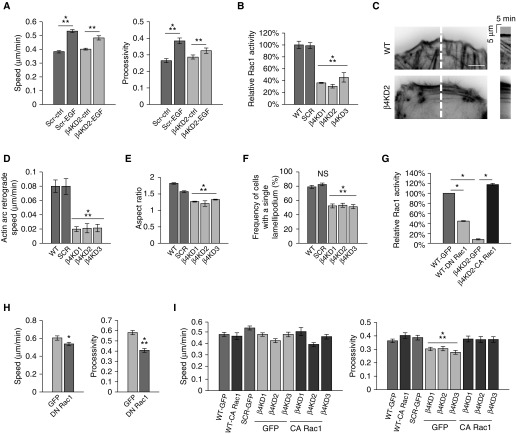
Figure 5.
β4 integrin expression regulates Ras-related C3 botulinum toxin substrate 1 (Rac1) signaling and actin dynamics. (A) After a 1-hour incubation in vehicle or 10 ng/ml epidermal growth factor (EGF), the motility of SCR and β4KD2 cells was assayed. (B) A Rac1 G-LISA activation assay was performed on cells 2 days after plating (two experiments). (C) Actin arc bundle retrograde movement was visualized in cells expressing red fluorescent protein–tagged LifeAct. Kymographs (right panels) were generated along the 5-pixel-wide line (red) shown in the left panels. Scale bar, 10 µm. (D) Quantification of kymographs, two examples of which are shown in C (3 experiments, >10 cells per experiment). (E) Quantification of cellular aspect ratio (3 experiments, >100 cells). (F) Quantification of the number of cells with exactly one lamellipodium (3 experiments, >100 cells per experiment). (G) A Rac1 G-LISA activation assay was performed on cells 2 days after infection with adenovirus encoding the indicated protein (two experiments). (H) Quantification of the speed and processivity of GFP or dominant-negative Rac1 (DN Rac1)–expressing A549 cells (3 experiments, >25 cells per experiment). (I) Quantification of the speed and processivity of WT, SCR, β4KD cells, and both WT and β4KD cells expressing constitutively active Rac1 (CA Rac1; 3 experiments, >25 cells per experiment). Results are presented as means (±SEM). Statistical analyses: t test (H); ANOVA (B, D–F, and I). Because ANOVA indicated differences between groups in A and G, specific groups were compared by t test, as indicated. *P < 0.05, **P < 0.01, ⁂P < 0.001.

