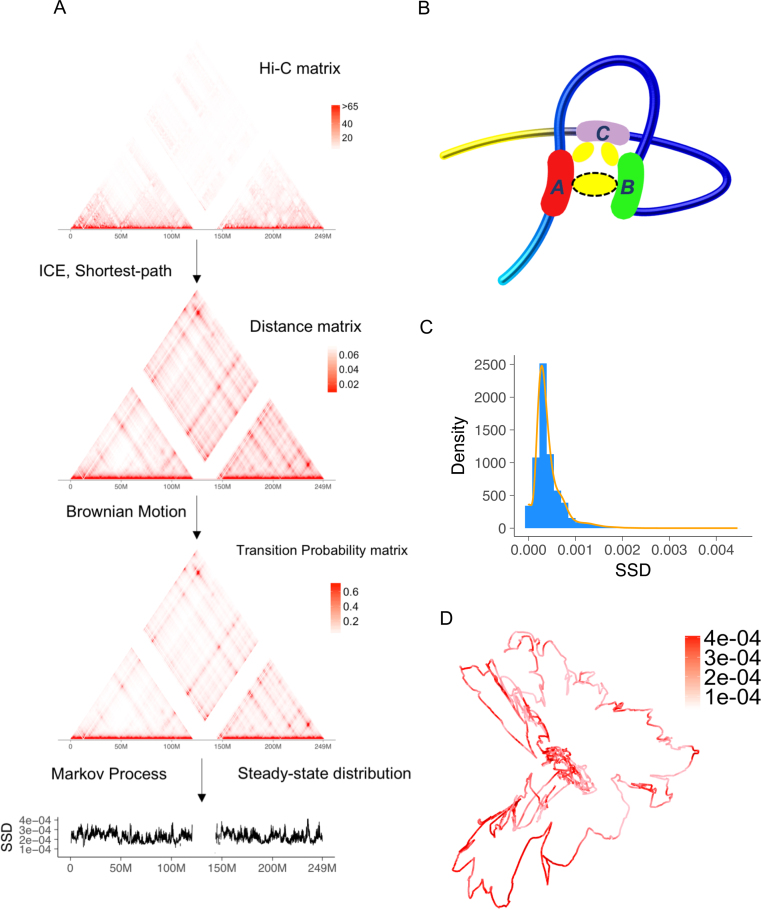
Figure 1.
Overview of Markov process model and steady-state distribution (SSD). (A) We use a public Hi-C dataset, the GM12878 cell line from Rao et al. (8) to illustrate the procedure. The input of model is Hi-C raw contact matrix. In the pre-processing step, the raw matrix is normalized and transformed to a distance matrix. Low coverage bins are removed after normalization. The distance matrix estimates relative spatial distances between two chromatin bins in the nucleus, accounting for physical distances captured by Hi-C cross-linking. Then the transition matrix is estimated and SSD is computed. (B) Advantage of shortest-path algorithm. Hi-C crosslinking could anchor region A and C, region B and C but not region A and B. As a result, although region A and B's spatial distance is close, the number of detected Hi-C interactions between A and B is underestimated and needs to be corrected by a shortest-path algorithm. (C) Density and histogram plot of GM12878 whole genome's SSD. (D) A 3D visualization of GM12878's chromosome 1 and SSD, both inferred from Hi-C data.

