Figure 2.
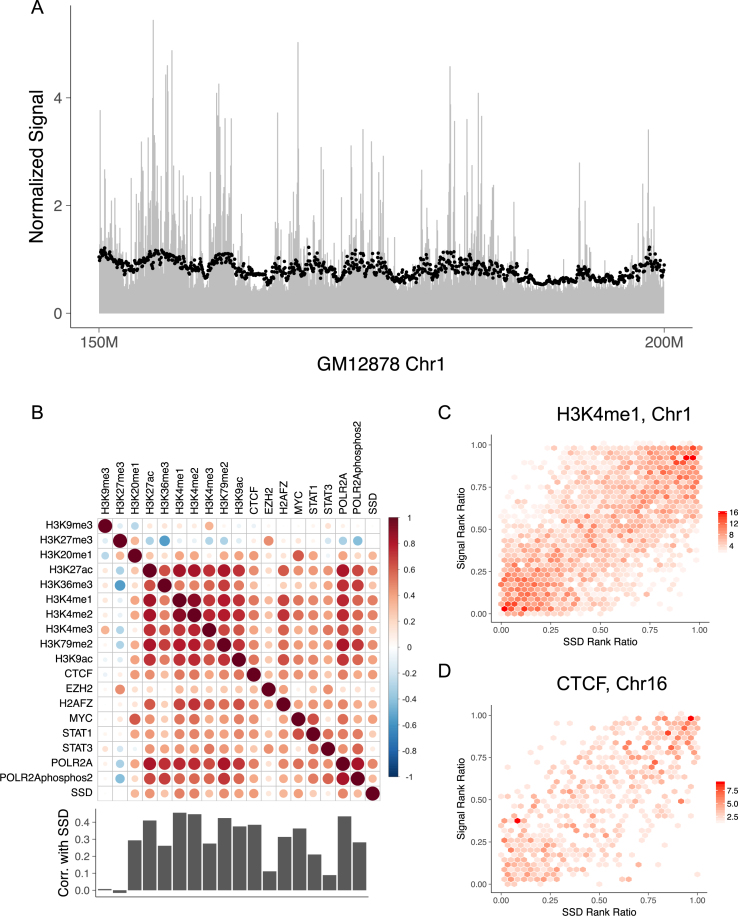
The distributions of histone modifications and DNA-binding proteins follow SSD. (A) ChIP-seq reads’ distribution along GM12878's chromosome 1. The chromosome is cut into 50 kb non-overlapping bins and RPM (reads per million) of H3K4me1 is computed for each bin to represent the mark's concentration. Black points represent SSD and are scaled for comparison. Only 150–200 Mb regions of chromosome 1 is shown. (B) Spearman correlation between ChIP-seq signals and SSD in 50 kb resolution for GM12878 using whole genome data. Bar plot shows Spearman correlation between SSD and ChIP-seq signals. (C) Hexbin plot showing the correlation between SSD and H3K4me1 signal on GM12878's chromosome 1. The color represents the density of points within each region. Rank ratio is defined as: (rank–min (rank))/(max (rank)–min (rank)). (D) Similar figure as Figure 2C using GM12878 chromosome 16, SSD and CTCF data.

