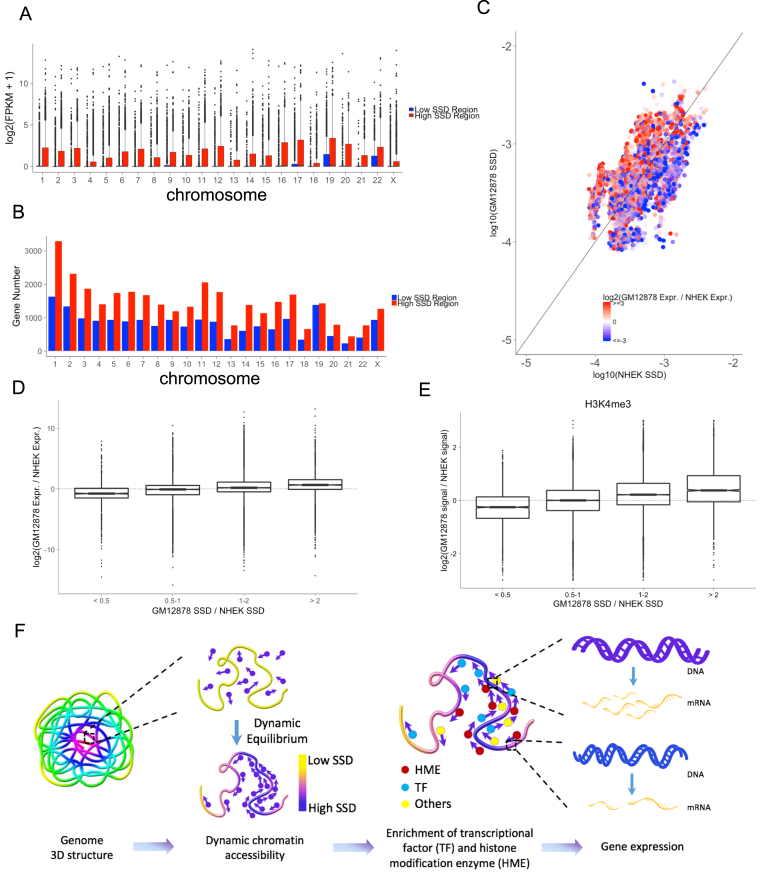
Figure 3.
SSD influences chromatin regions’ accessibility and transcriptional activity. (A) The comparison of expression levels of genes located in high and low SSD regions for each chromosome. For each chromosome, high SSD regions are defined as bins with SSD higher than the median SSD. Low SSD regions are the ones with SSD lower than the median SSD. (B) The number of genes located in high and low SSD regions. (C) Comparing SSD and gene expression levels between two cell lines, GM12878 and NHEK. Points colors represent the log2 fold change of GM12878 and NHEK's gene expression (FPKM). Points above the diagonal are the regions with higher SSD in GM12878 and under the diagonal are those with higher SSD in NHEK. (D) Relationship between SSD fold change and gene expression fold change comparing two cell lines. (E) Relationship between SSD fold change and H3K4me3 ChIP-seq signal fold change comparing two cell lines. (F) Model for how dynamic chromatin accessibility affects gene expression. Regions with high SSD are more accessible for histone modification enzymes and transcriptional factors, leading to higher transcriptional activity in these regions.

