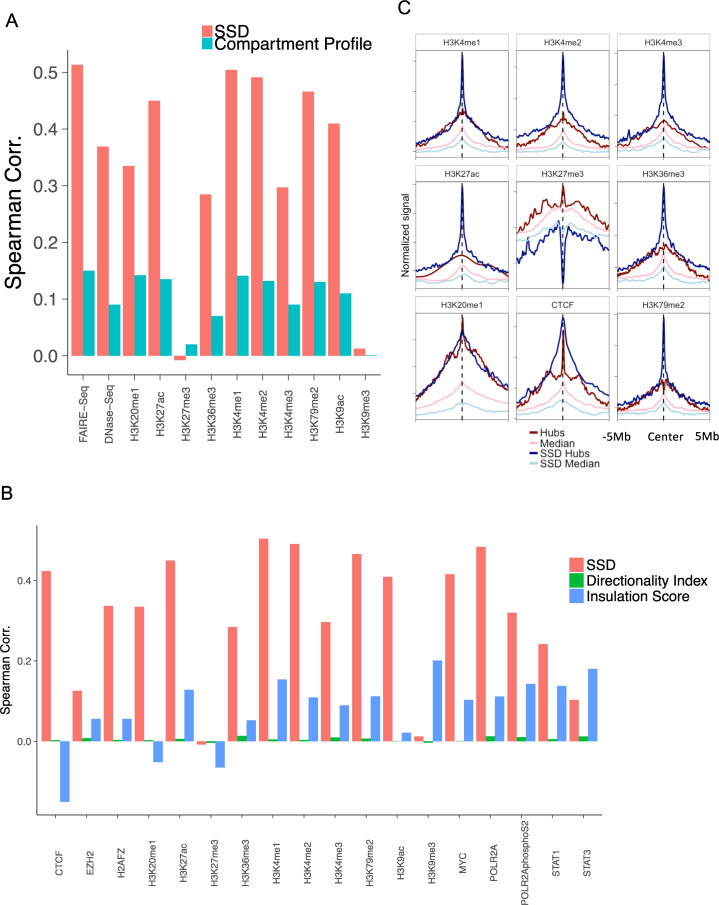
Figure 4.
Comparing SSD with compartment profile and hub. (A) GM12878 SSD's and compartment score's Spearman correlations with ChIP-seq signals of histone modifications, FAIRE-seq and DNase-seq at the whole genome scale. (B) GM12878 SSD's, insulation score's and directionality index's Spearman correlations with ChIP-seq signals of histone modifications and DNA-binding proteins at the whole genome scale. (C) Comparing histone mark signatures between hubs and SSD hubs. X-axis represents the relative distance from hubs/median center (−5 to 5 Mb) and Y-axis represents averaged ChIP-seq signals.

