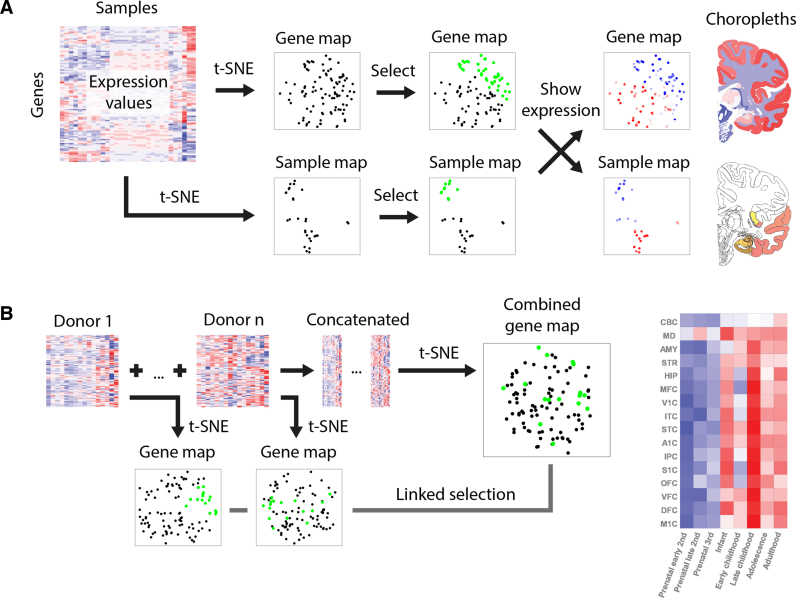
Figure 1.
BrainScope views. (A) In the dual explorer, the gene expression data is visualized in two directions: a map for genes and a map for samples. Points that are close in the map have a high similarity. The portal allows for selection of points in either of the maps and shows the expression in the other map (red is high, blue is low): a set of genes has a profile across samples, which is averaged; and a set of samples has expression values in all genes, which are also averaged. When genes are selected, their average expression is also shown on brain slice choropleths; and when samples are selected, their location is shown on the same choropleths. (B) In the comparative explorer, only gene t-SNE maps are shown, but it contains data for multiple donor brains (replicates, or developmental stages). A t-SNE map is made for each donor and, in addition, one map is made for the combined data sets. When a selection of genes is made in either of the maps, this selection is carried over to the other maps and the average regional expression of these genes is shown in a heatmap.

