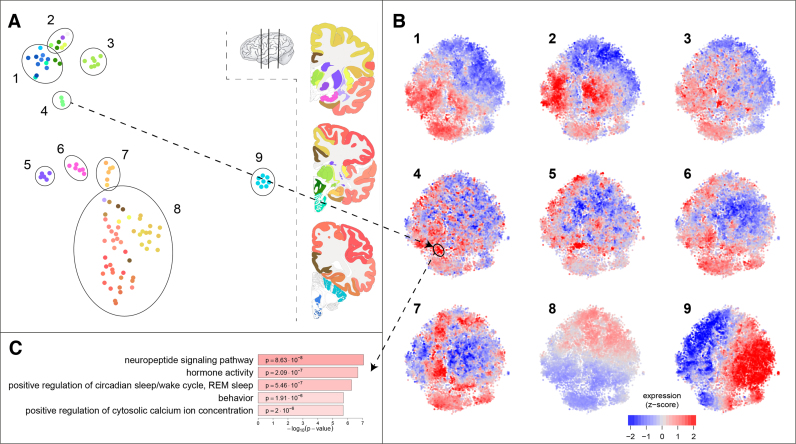
Figure 2.
Characterization of the gene and sample maps in the dual explorer. (A) The samples show a clustered pattern, matching the anatomical annotation shown in the color coding of the brain slices on the right. Nine groups of samples are highlighted in the map. (B) The mean expression of the nine groups of samples shown on the gene map. Each cluster of samples has its own distinct expression pattern, where red is high expression and blue is low expression. The dual explorer facilitates exploration of gene-sample relationships. The hypothalamus samples that are selected in A4 have a high expression in the gene cluster highlighted in B4. (C) The five strongest GO-term enrichments in the hypothalamus related gene cluster, which point to well-known hypothalamus functions.

