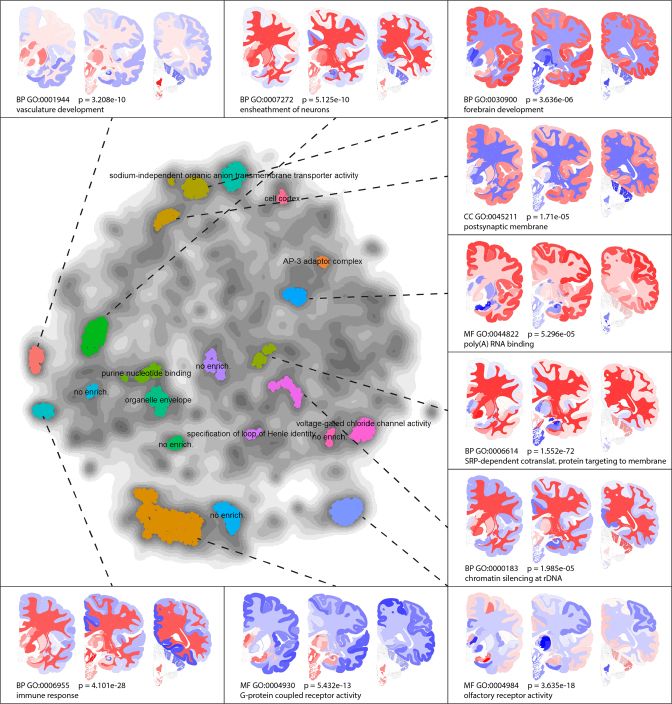
Figure 3.
Functional characterization of the gene map: 3000 genes within the highest densities were clustered, and clusters containing over 30 genes were characterized using ToppGene. Only the most significant GO-term is shown for each cluster, while the 10 clusters with strongest enrichments are provided with spatial expression choropleths. Most high-density areas in the gene map contain genes with common functions. All P-values are Bonferroni corrected in ToppGene, and the gene modules are provided in Supplementary Table S2.

