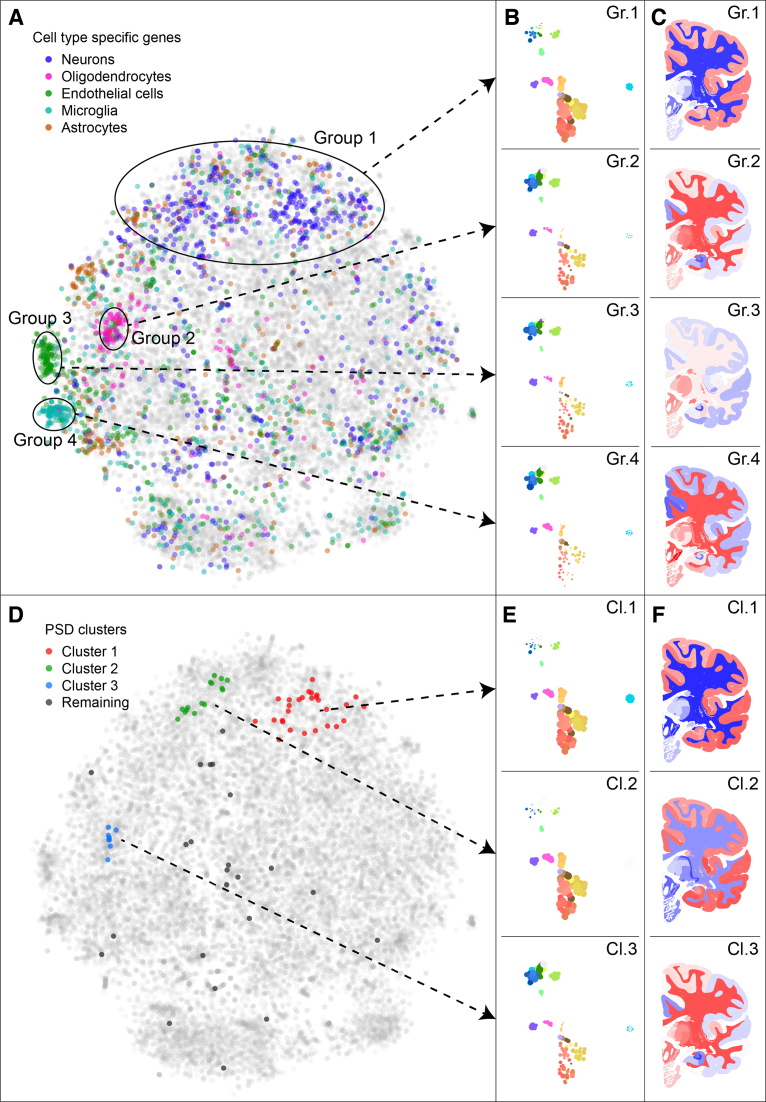
Figure 4.
Gene sets show cell type specificity of spatial gene expression and clusters of post synaptic density related genes. (A) The adult human gene t-SNE map, with highlighted cell type markers. The cell type markers were picked based on data from fluorescence-activated cell sorted brain cells from mouse (24), as genes with 20-fold expression in one of the types compared to the geometric mean in the other types. In the map, four groups of genes are highlighted, which correspond to areas of the map with high numbers of cell type markers. (B) The mean expression of all genes in the four groups in the gene map, shown by point sizes in the sample maps. (C) The mean expression of all genes in the same four groups, shown on a brain slice. (D) The adult human gene t-SNE map with highlighted post synaptic density (PSD) related genes (19). Three clusters of co-expressed PSD related genes are highlighted. (E and F) The expression patterns of the three clusters, shown in the sample t-SNE map and choropleths. Clusters 1 and 2 contain genes mostly expressed in the cerebral cortex, where cluster 2 is distinct from cluster 1 because of its stronger expression in cerebellar cortex. Genes in cluster 3 are expressed most strongly in subcortical regions such as thalamus, hypothalamus, and brain stem.

