Figure 6.
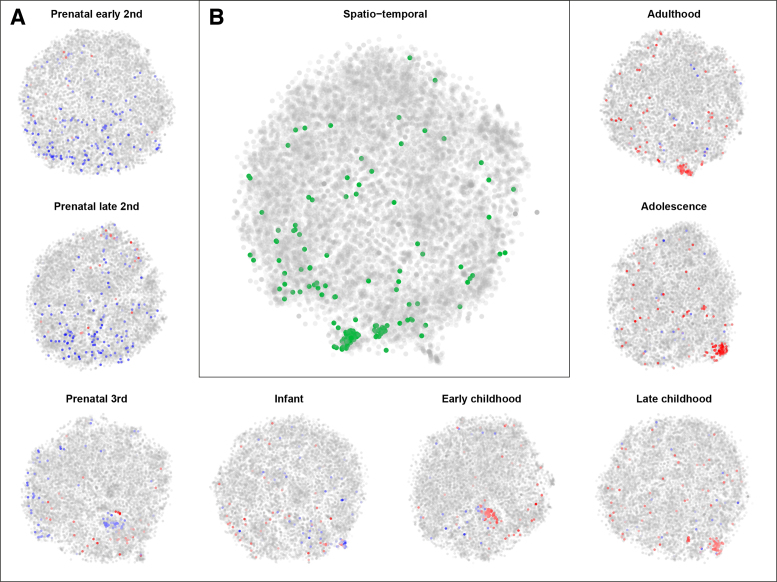
Developmental gene expression patterns show oligodendrocyte activity after birth. (A) The gene t-SNE maps per developmental stage. These maps reflect spatial co-expression of genes at each stage of development from early second trimester to adulthood. Oligodendrocyte marker genes are highlighted by their average expression across the brain at that stage of development. The oligodendrocyte marker genes have a low pre-natal expression (blue) and, as a result, a weak co-expression. After birth these genes become more active (red), and more co-expressed, which reflects the formation of white matter after birth. (B) The spatio-temporal gene t-SNE map of gene expression. Genes cluster together if they have a similar expression pattern through developmental time and anatomical space. The highlighted genes (green) are those that are oligodendrocyte specific.

