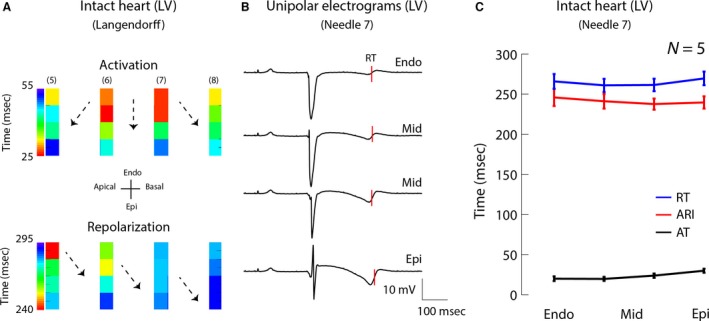
Figure 1.

Activation and repolarization sequence in the left ventricle of a Langendorff‐perfused canine heart. (A) Activation (upper) and repolarization (lower) pattern in a section of the left ventricle based on four transmural needle electrodes (pacing interval 800 msec). Black dots represent electrodes. Areas between the black dots were interpolated. (B) Unipolar electrograms recorded with needle 7. The red lines indicate the moments of repolarization along needle 7. (C) The line graph shows the average activation and repolarization times and ARI gradient along needle 7 in five animals. LV, left ventricle; AT, activation time; RT, repolarization time; Endo, subendocardium; Mid, mid‐myocardium; Epi, subepicardium; ARI, activation recovery interval.
