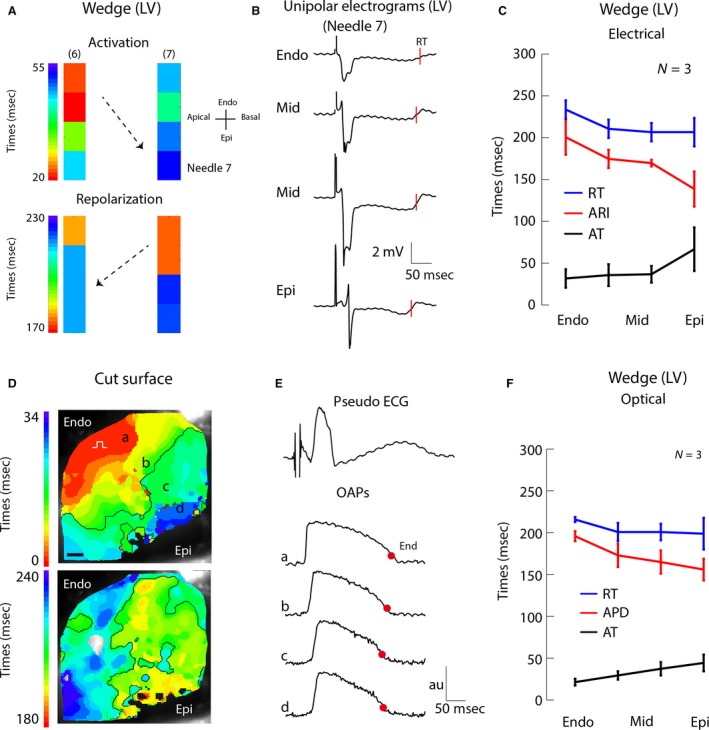
Figure 2.

Activation and repolarization sequence in the perfused LV wedge preparation obtained from electrical (A–C) and optical (D–F) recordings. (A) Reconstructed activation (upper) and repolarization (lower) pattern in the LV wedge preparation based on two transmural needle electrodes (pacing interval 800 msec). Black dots represent electrodes. Areas between the black dots were interpolated. (B) Unipolar electrograms recorded with needle 7 (same needle as in Fig. 1B). The red lines indicate the moments of repolarization. (C) The line graph shows the average activation and repolarization times and ARI gradient along needle 7 in three animals. (D) Reconstructed activation (upper) and repolarization (lower) patterns in the LV wedge preparation based on optically recorded action potentials. (E) The upper tracing shows a pseudo‐ECG recorded simultaneously with the optical potentials. The three lower tracings show optical action potentials at regions indicated in panel (D) The red dots represent the 80% of repolarization. (F) The line graph shows the average activation and repolarization pattern and APD gradient at the position of needle 7 in three animals. Au, arbitrary units; LV, left ventricle; AT, activation time; RT, repolarization time; Endo, subendocardium; Mid, mid‐myocardium; Epi, subepicardium; OAP, optical action potentials; APD, action potential duration; ECG, electrocardiogram.
