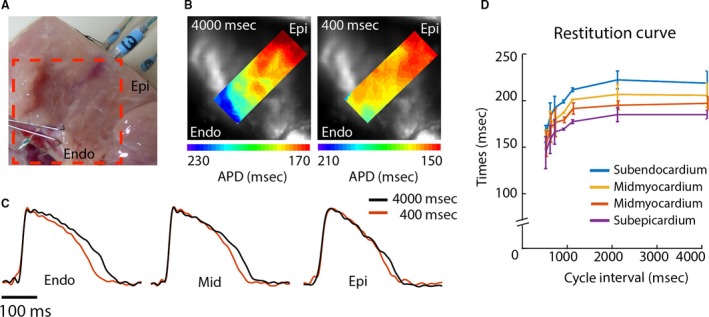
Figure 3.

Action potential restitution characteristics at the cut surface of the coronary‐perfused LV wedge preparation. (A) Photograph of the LV wedge preparation showing the field of view used for the optical recordings. (B) Reconstructed action potential duration gradients near the contact region of the needle electrode during 4000 msec (left) and 400 msec (right) stimulus intervals. (C) Optical action potentials at the subendocardium, mid‐myocardium, and subepicardium during 4000 msec (black) and 400 msec (red) stimulus intervals. (D) The line graph shows the average APD at different cycle lengths in the subendocardium (Endo), mid‐myocardium (Mid), and subepicardium (Epi). Au, arbitrary units.
