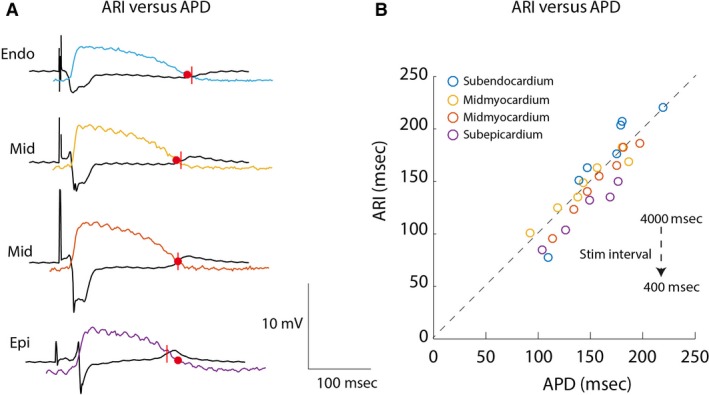
Figure 4.

The relation between electrically recorded activation recovery intervals and optically recorded action potentials. (A) The tracings show transmurally recorded electrograms from the internal wedge preparation and superimposed optical action potentials recorded at the cut surface. (B) The graph shows the correlation between optically recorded action potential durations and activation recovery intervals recorded from the internal wedge preparation from the subendocardium, mid‐myocardium, and subepicardium at decreasing cycle intervals. Endo, subendocardium; Epi, subepicardium; Mid, mid‐myocardium; APD, action potential duration; ARI, activation recovery interval.
