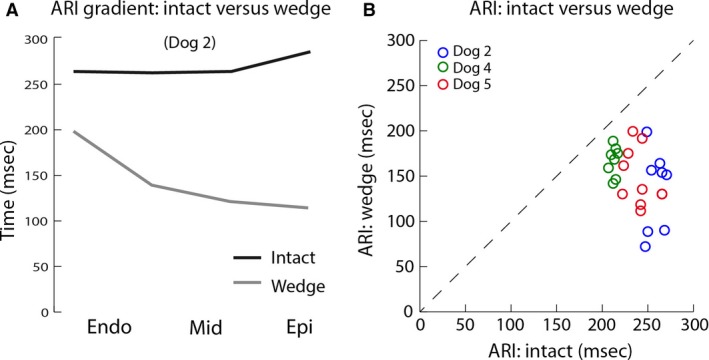
Figure 5.

The relation between activation recovery intervals recorded from the intact heart and LV wedge. (A) The graph shows the activation recovery interval gradients in the intact heart and the LV wedge at the same location during 800 msec cycle intervals. (B) The graph shows the correlation between activation recovery intervals recorded in the intact heart and the LV wedge at the same location in three animals during pacing with 800 msec cycle interval. Endo, subendocardium; Epi, subepicardium; Mid, mid‐myocardium; ARI, activation recovery interval.
