
Figure 1.
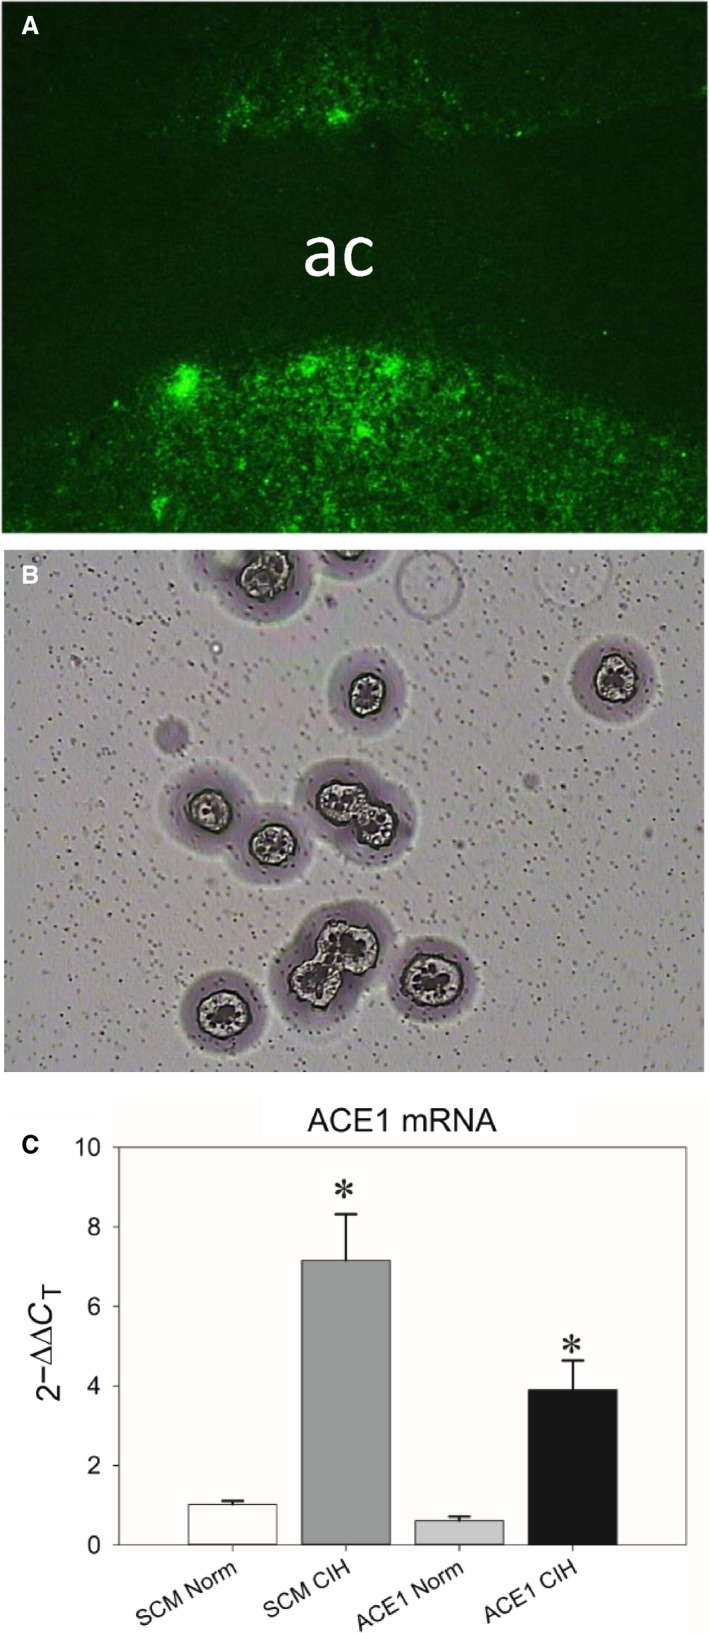
A: Representative digital image of fluorescent green fluorescent protein (GFP) positive cells within the MnPO before LCM (image captured at 100X). B: A brightfield image of GFP cells harvested by LCM and deposited for subsequent analysis (image captured at 200x). C): CIH significantly increased ACE1 mRNA in the MnPO and this effect was significantly attenuated by AAV‐shACE1. * is different from all other groups (Student‐Neuman‐Keuls tests, P < 0.05; n = 4‐7/group).