
Figure 6.
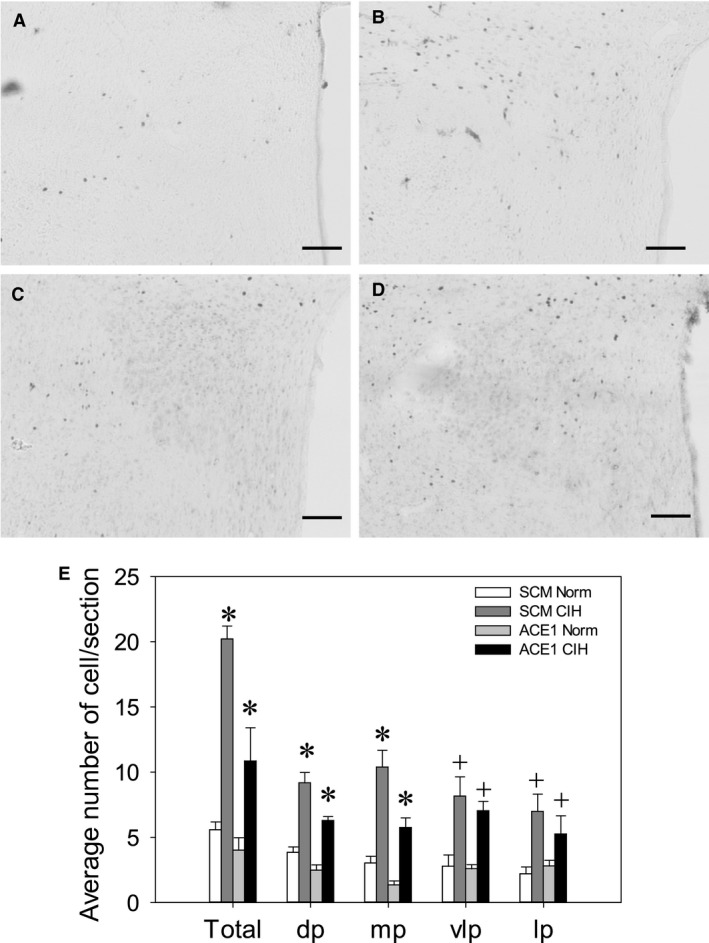
Effects of shACE1 knockdown on FosB staining in the PVN. Representative images for each treatment group ‐ A: SCM Norm, B: SCM CIH, C: ACE1 Norm and D: ACE1 CIH. E: Summary data for FosB staining in the total PVN (Total), dorsal parvocellular region (dp), medial parvocellular (mp), ventrolateral parvocellular and lateral parvocellular regions (n = 6/group). * is significantly different from all other groups (P < 0.05). + is both CIH groups different from both CON groups (P < 0.05) Scale bars are 100 μm.