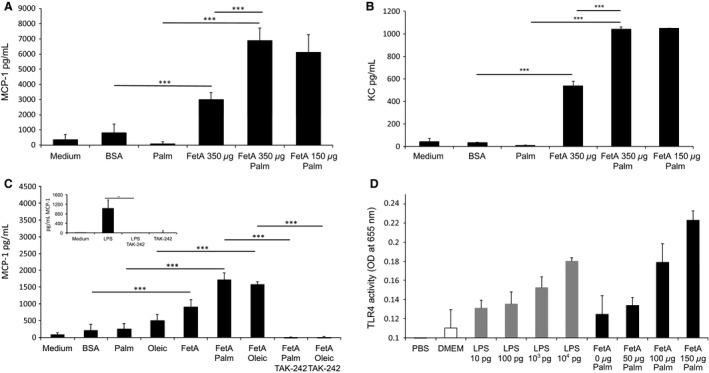
Figure 1.

FetA but not palmitic acid or oleic acid stimulates MCP‐1 or KC secretion in podocyte. (A) Graph shows MCP‐1 expression after treating podocytes with 75 μmol/L palmitic acid (palm) or bovine serum albumin (BSA) (control) either with or without 150–350 μg/mL bovine FetA. Bar graph represents mean ± SD MCP‐1 levels (in pg/mL) in the supernatant after 12 h (n = 6, ***P < 0.001). (B) Graph shows KC expression after treating podocytes with 75 μmol/L palm or BSA (control) either with or without 150–350 μg/mL bovine FetA. Bar graph represents mean ± SD KC levels (in pg/mL) in the supernatant after 12 h (n = 6, ***P < 0.001). (C) Graph shows MCP‐1 expression in podocytes treated with 75 μg/mL palm or 75 μg/mL oleic acid (oleic) alone or in combination with 200 μg/mL murine FetA. Bar graph represents mean ± SD MCP‐1 levels (in pg/mL) in the supernatant after 16 h of treatment and 1 h of preincubation with TAK‐242 (n = 4, ***P < 0.001). Insert: LPS induces MCP‐1 release, and TAK‐242 prevents chemokine expression. Podocytes were treated with 5 ng/mL LPS. Bar graph represents mean ± SD MCP‐1 levels (in pg/mL) in the supernatant after 16 h of treatment and 1 h of preincubation with TAK‐242 (n = 4, **P < 0.01). (D) Graph shows TLR4 activation in HEK‐Blue™ hTLR4 cells treated with LPS (10 pg, 100 pg/mL, 103 pg/mL, 104 pg/mL) or 150 μmol/L palmitic acid in the presence of murine FetA (0 μg/mL, 50 μg/mL, 100 μg/mL, 150 μg/mL) for 18 h. Bar graph represents mean percentages ± SD of OD reading (n = 3).
