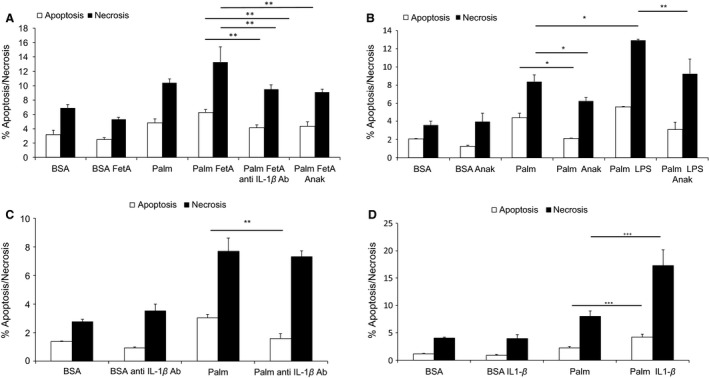
Figure 4.

Antagonization of IL‐1 attenuates FetA or LPS exacerbated palmitic acid‐induced podocyte death. (A) Graph shows podocytes treated with 200 μmol/L palmitic acid (palm) or bovine serum albumin (BSA) (control) alone or in combination with 200 μg/mL bovine FetA for 48 h, and preincubated for 1 h with 1 ng/mL TAK‐242, or 3.3 μg/mL anti‐IL‐1β antibody, or 1 μg/mL IL‐1Ra (Anakinra). Bar graph represents the mean percentages ± SD of Annexin V‐positive/PI‐negative (early apoptotic) and Annexin V‐positive/PI‐positive (late apoptotic/necrotic) podocytes (n = 3, **P < 0.01, ***P < 0.001). (B) Graph shows podocytes exposed to palm or BSA (control) alone or in combination with 1 ng/mL LPS, and preincubated for 30 min with 1 μg/mL anakinra. Podocytes were treated for 48 h. Bar graph represents the mean percentages ± SD of Annexin V‐positive/PI‐negative (early apoptotic) and Annexin V‐positive/PI‐positive (late apoptotic/necrotic) podocytes (n = 3, *P < 0.05, **P < 0.01). (C) Graph represents podocytes exposed to 200 μmol/L palm or BSA (control) alone or preincubated for 1 h with 3.3 μg/mL anti‐IL1β antibody. Podocytes were treated for 48 h. Bar graph represents the mean percentages ± SD of Annexin V‐positive/PI‐negative (early apoptotic) and Annexin V‐positive/PI‐positive (late apoptotic/necrotic) podocytes (n = 3 *P < 0.05, **P < 0.01). (D) Graph shows podocytes treated with 200 μmol/L palm or BSA (control) and 5 ng/mL IL‐1β for 48 h. Bar graph represents the mean percentages ± SD of Annexin V‐positive/PI‐negative (early apoptotic) and Annexin V‐positive/PI‐positive (late apoptotic/necrotic) podocytes (n = 3, ***P < 0.001).
