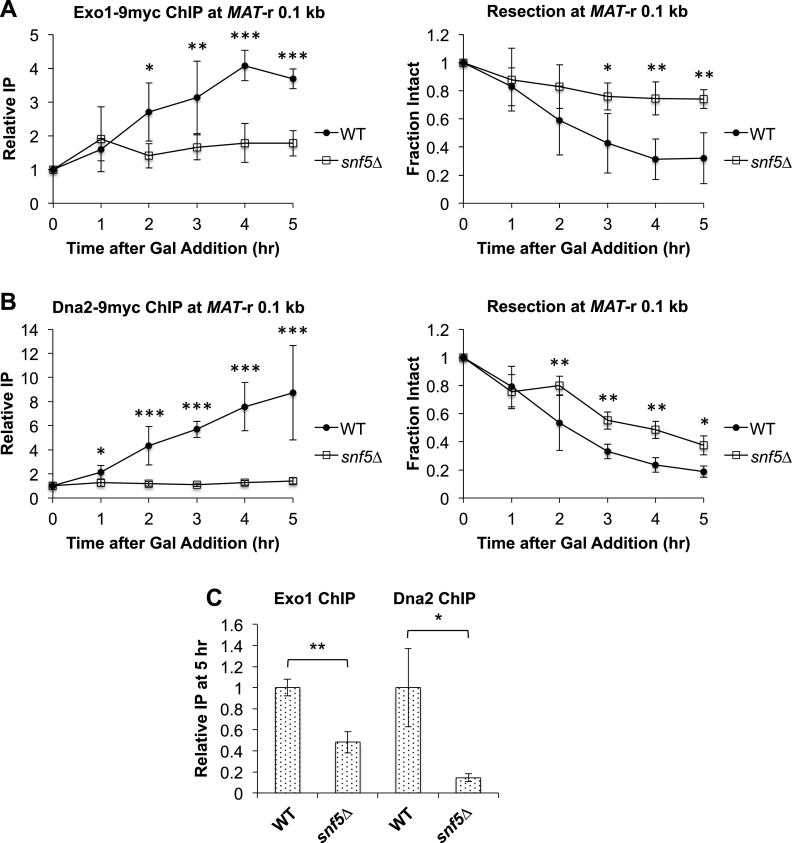
Figure 4.
Recruitment of Exo1 and Dna2 to a MAT DSB is impaired in snf5Δ cells. Asynchronous WT (n = 3) and snf5Δ (n = 3) strains containing Exo1-Myc or Dna2-Myc were harvested at 1 h intervals after addition of galactose to induce a MAT DSB. Recruitment of (A) Exo1-Myc or (B) Dna2-Myc 0.1 kb to the right of the MAT DSB was monitored by ChIP (left) and DNA end resection was simultaneously monitored (right). Error bars denote one standard deviation. Statistical differences between strains at time points were assessed by two-way ANOVA with Holm–Sidak post-hoc analysis. *P < 0.05, **P < 0.01, ***P < 0.001. (C) Recruitment of Exo1-Myc and Dna2-Myc at 5 h in snf5Δ relative to recruitment in WT, which was set as 1. Error bars denote one standard deviation. Statistical differences between recruitment at 5 h in WT and snf5Δ cells were assessed by Student's t-test. *P < 0.05, **P < 0.01.

