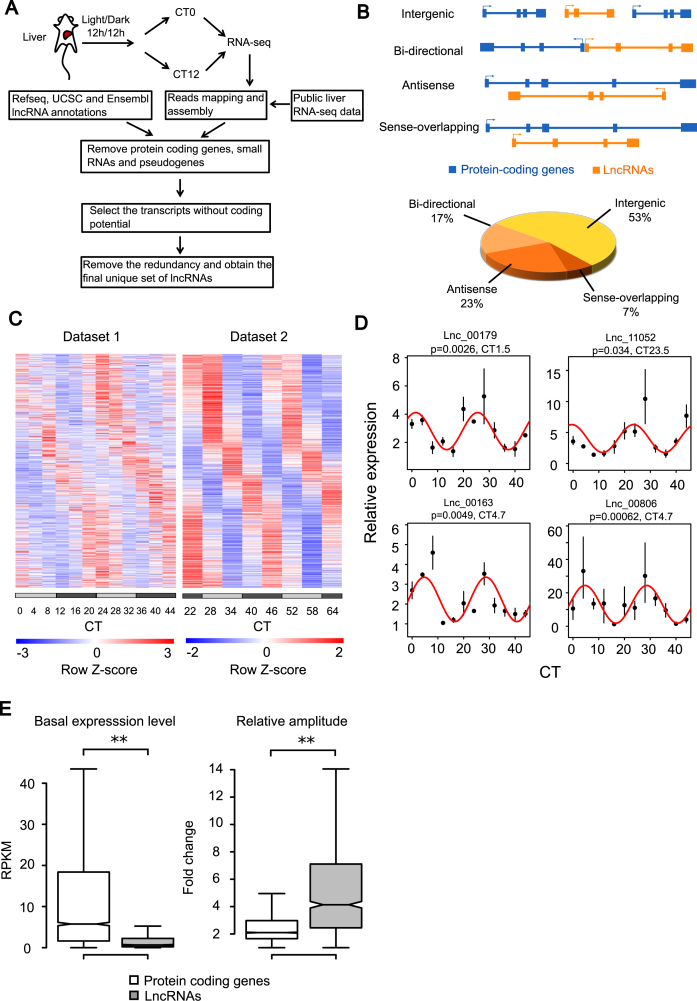
Figure 1.
Identification of circadian lncRNAs in mouse liver. (A) The schematic work flow of de novo lncRNA assembly from RNA-seq data of mouse liver and integration with public annotation of lncRNAs. (B) Classification of lncRNAs based on their genomic locations relative to protein coding genes and the percentage of each category. (C) Heatmap of circadian expression of all circadian lncRNAs identified by the meta-analysis of dataset 1 (20) and dataset 2 (21). (D) Four selected circadian lncRNAs validated by quantitative polymerase chain reaction (qPCR) (n = 2–3). Lines were the best fitted cosine functions with fitted P-values and phases. All expression values in qPCR were quantified relative to expression of Actb. (E) Comparison of basal expression levels and relative amplitudes between circadian lncRNAs and circadian protein coding genes revealed lower expression levels but higher relative amplitudes of circadian lncRNAs than circadian protein coding genes. Relative amplitude was calculated by the ratio between peak and trough of circadian expression. Kolmogorov–Smirnov (KS) test was performed for the comparisons of both basal expression levels (P-value < 2.2 × 10⁻¹⁶) and relative amplitudes (P-value < 2.2 × 10⁻¹⁶), where the significance level was determined by ** P-value < 0.01 and * P-value < 0.05.

