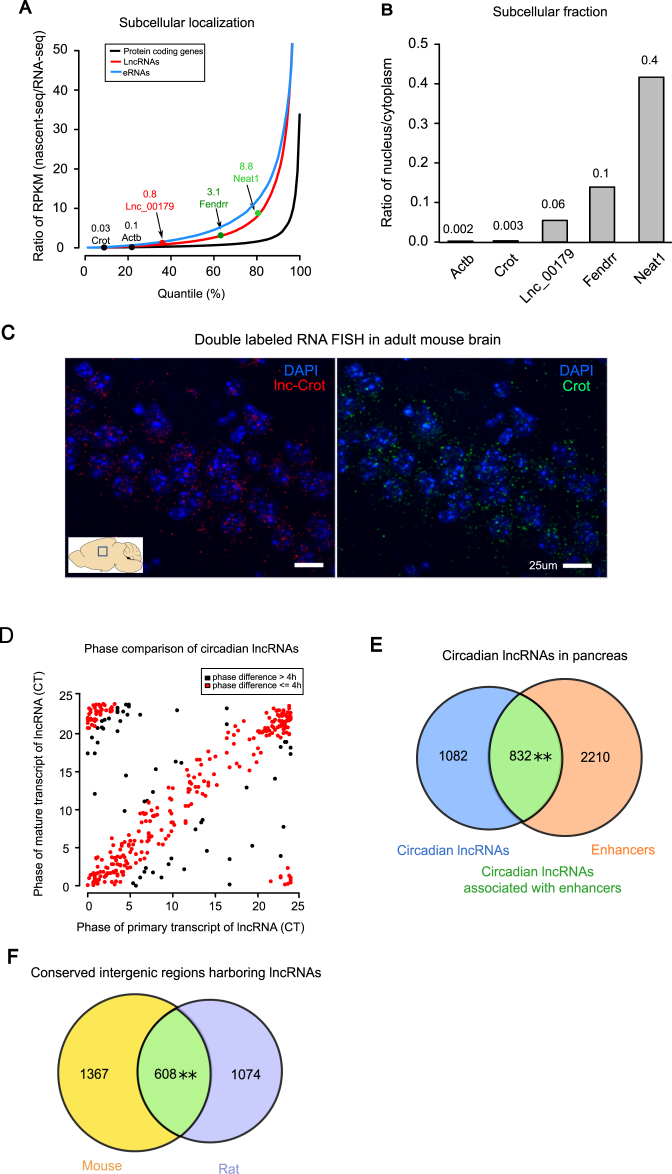
Figure 3.
Subcellular localization of circadian lncRNAs in liver and circadian lncRNAs in non-hepatic tissues. (A) Distributions of relative nucleus to cytoplasm ratios for protein coding genes, lncRNAs and enhancer RNAs (eRNAs). Protein coding genes Actb and Crot, lncRNAs Fendrr and Neat1, and one selected circadian lncRNA were highlighted. Comparisons were performed using KS test, where **P-value < 2.2 × 10⁻¹⁶ (coding genes vs. lncRNAs) and **P-value = 2.2 × 10⁻¹⁶ (lncRNAs vs. eRNAs). (B) Relative nucleus to cytoplasm ratios assayed by qPCR of extracted RNAs separately from nucleus and cytoplasm in mouse liver. (C) Double RNA FISH confocal imaging of Crot mRNA labeled with FITC (right image, green), lnc-Crot labeled with DIG (left image, red) and nucleus labeled with DAPI (blue) in CA3 region of hippocampus in adult mouse brain (P56). Images were taken at 60× magnification. Scale bar: 25 μm. (D) Phases of circadian lncRNAs that also oscillated on nascent-seq. Phases of circadian lncRNAs from RNA-seq (Y-axis) and nascent-seq (X-axis) were plotted. Red ones are the lncRNAs with phase differences <4 h between RNA-seq and nascent-seq. (E) Circadian lncRNAs in pancreas also have significant overlap with the enhancers in pancreas. Pancreatic lncRNAs were assembled and identified by RNA-seq data of pancreas and enhancers were identified by H3K27ac ChIP-seq of pancreas (58). Significance level was determined by Fisher's exact test, where **P-value = 0.007. (F) Overlap of intergenic regions harboring lncRNAs in mouse and rat is significant (Fisher's exact test **P-value < 2.2 × 10⁻¹⁶).

